Platinum (PL) broke to new all-time highs late last year, signaling the potential start of a secular bullish market in the years ahead. In this article, we examine the long-term outlook for the metal and its evolving Elliott Wave structure.
Platinum (PL) Monthly Elliott Wave Chart
The monthly Platinum chart shows the metal has broken out to new all-time highs, reinforcing a bullish outlook. Platinum remains in a multi-year secular uptrend. The rally from January 1992 to the March 2008 peak completed wave ((I)) at 2308.8. This was followed by a corrective zigzag decline to 563, marking the end of wave ((II)). From that low, the metal resumed higher and has now broken into fresh highs with an impulsive internal structure.
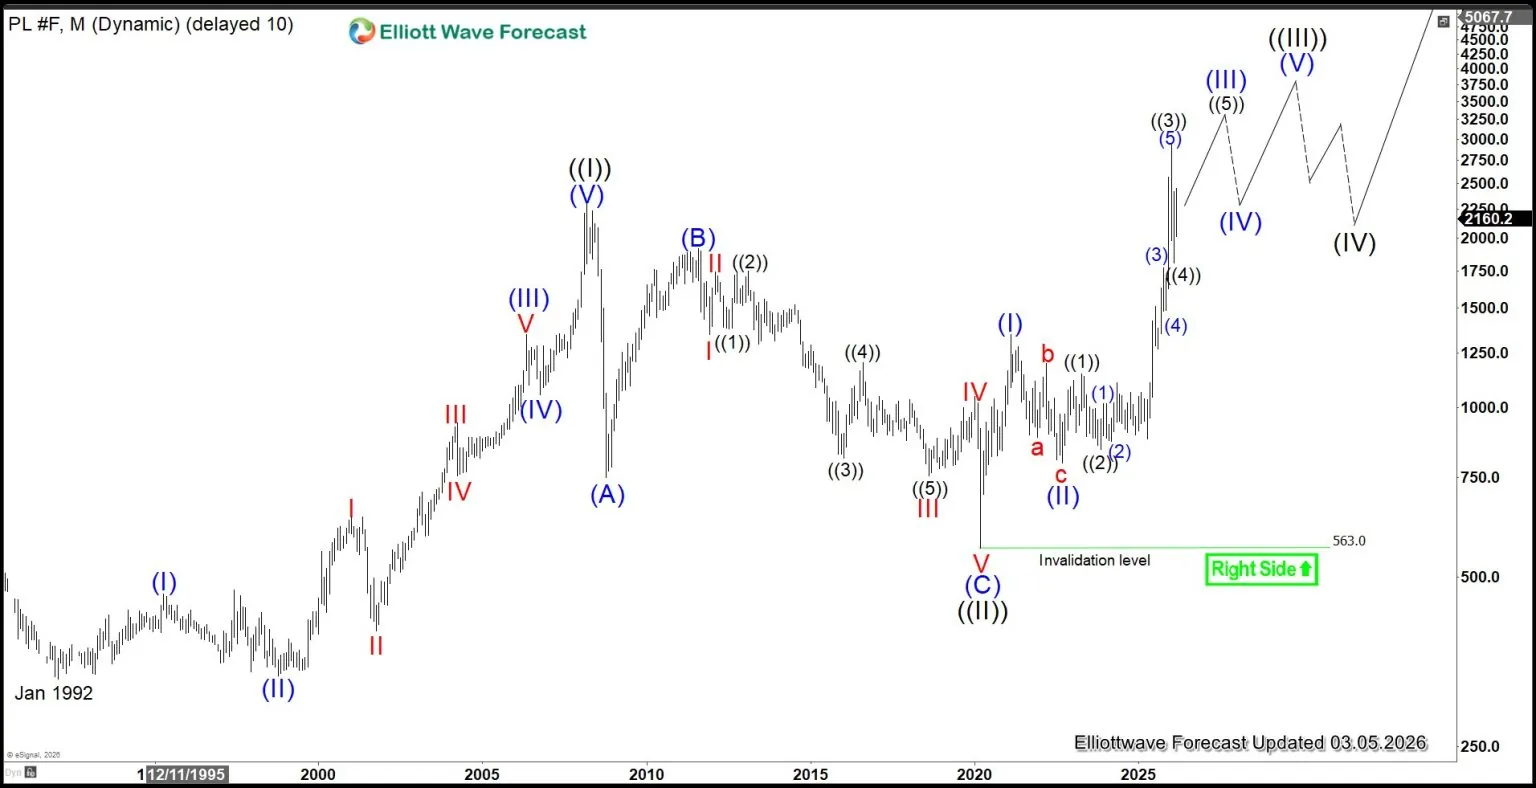
From wave ((II)), wave (I) ended at 1348.2, while the subsequent pullback in wave (II) bottomed at 796.8. Platinum then advanced within wave (III), which is expected to extend one more leg before completion. As long as the metal holds above 563.8, corrective dips should continue to find support in three- or seven-swing structures, setting the stage for further upside.
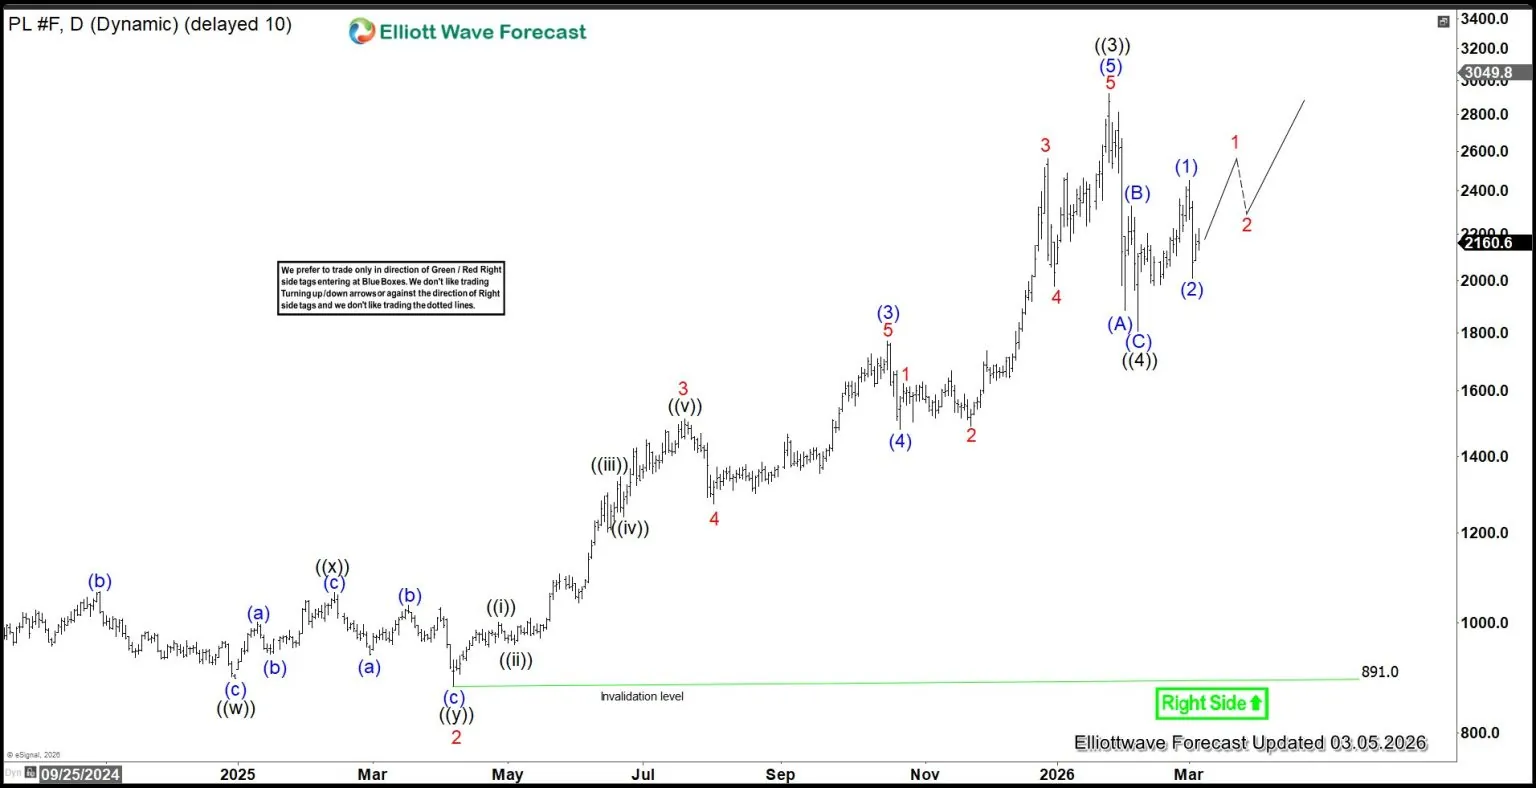
Platinum (PL) Daily Elliott Wave Chart
The daily Platinum chart shows that the rally to 2925 completed wave ((3)). The subsequent pullback in wave ((4)) is proposed to have ended at 1806. However, the metal must break above the wave ((3)) high to rule out the possibility of a double correction. In the near term, as long as the pivot at the 891 low remains intact, the outlook stays bullish with dips expected to hold in three- or seven-swing corrections. If Platinum fails and breaks below 1806, the next support zone in a potential double correction lies between 662 and 1344, where buyers are anticipated to re-emerge.
Platinum (PL) Elliott Wave Video
You are currently viewing a placeholder content from Default. To access the actual content, click the button below. Please note that doing so will share data with third-party providers.