Global markets closed the week under the growing shadow of a rapidly escalating energy crisis. What began as a geopolitical confrontation in the Middle East has now evolved into a far broader macro shock, forcing investors to reassess everything from inflation risks and monetary policy to equity valuations and currency dynamics.
At the center of this shift is oil. The effective disruption of energy flows through the Strait of Hormuz has pushed crude prices sharply higher and injected a powerful new inflationary impulse into the global economy. Markets are increasingly grappling with the possibility that the conflict could evolve into a prolonged disruption to energy supply rather than a short-lived geopolitical flare-up.
The surge in oil prices is already reverberating through financial markets. Industrial equities have been among the hardest hit, with DOW leading the selloff as investors reassess the outlook for companies sensitive to fuel costs and global trade flows.
In the bond market, the picture is more complex. On one hand, rising oil prices threaten to reignite inflation pressures. On the other, surprisingly weak US labor market data has introduced doubts about the underlying strength of economic activity. The result is a Treasury market caught between inflation risk and growth uncertainty.
Dollar has benefited from this environment of heightened caution. As risk aversion intensifies and yields remain relatively stable, Dollar Index could soon be testing a key resistance levels that could determine whether a broader trend reversal is underway.
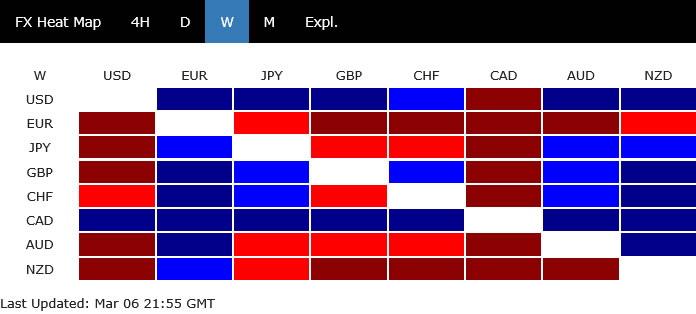
At the same time, the global energy divide is clearly visible in foreign exchange markets. Energy exporters such as Canada are gaining ground, while energy-importing regions like the Eurozone face growing pressure from rising fuel costs. The sharp decline in EUR/CAD has therefore emerged as one of the clearest market expressions of the widening economic divergence triggered by the oil shock.
Availability Crisis: Oil Markets Enter a New Regime
WTI crude oil closed the week above the USD 90 per barrel mark, capping a stunning 35% surge that marks the largest weekly gain since oil futures trading began in 1983. The speed and scale of the move highlights a dramatic shift in how the market is interpreting the current U.S.–Iran conflict. This is no longer simply a question of tight supply or demand recovery. Instead, traders are grappling with a much more unsettling reality: the availability of oil itself is now in doubt.
The effective shutdown of the Strait of Hormuz has transformed the geopolitical backdrop into a direct threat to the global energy system. Roughly one-fifth of the world’s oil consumption normally passes through the narrow waterway, and tanker traffic has largely halted since hostilities erupted. With ships unwilling to risk transiting the region amid the threat of missile and drone strikes, markets are being forced to price in a significant disruption to physical supply.
The latest leg higher in crude prices was triggered by comments from Qatar Energy Minister Saad al-Kaabi, who warned that Gulf exporters could soon declare force majeure. Such a move would legally release producers from their contractual delivery obligations. In practical terms, that would signal that the world is no longer facing a logistical bottleneck, but the potential evaporation of Middle Eastern supply.
Further fuel was added by rhetoric from Washington. U.S. President Donald Trump stated that the conflict with Iran would not end without an “unconditional surrender,” reinforcing expectations that the confrontation could become a prolonged campaign rather than a short-lived operation. Markets have interpreted such language as a signal that disruptions in the Gulf may persist for weeks or even months.
The administration attempted to calm nerves by announcing a USD 20 billion reinsurance program for oil tankers and maritime shipping. The initiative aims to encourage vessels to resume transit through the Strait of Hormuz by protecting owners from financial losses if ships are damaged or destroyed. Yet the market response was muted.
The reason is straightforward: insurance addresses financial risk, not physical danger. Shipowners may be compensated if a vessel is lost, but the threat of direct military strikes still makes transiting the Strait an unattractive proposition. As traders put it, you can insure a ship, but you cannot insure global energy supply.
Traders remain skeptical that insurance alone will persuade operators to “run the gauntlet” through one of the most volatile conflict zones in the world. Until the physical security of the waterway improves, supply disruptions are likely to persist.
Against this backdrop, technical analysis offers only limited guidance. The magnitude of the geopolitical shock has overwhelmed traditional models, making price patterns less reliable than usual. Nevertheless, the recent rally has triggered a number of notable technical developments.
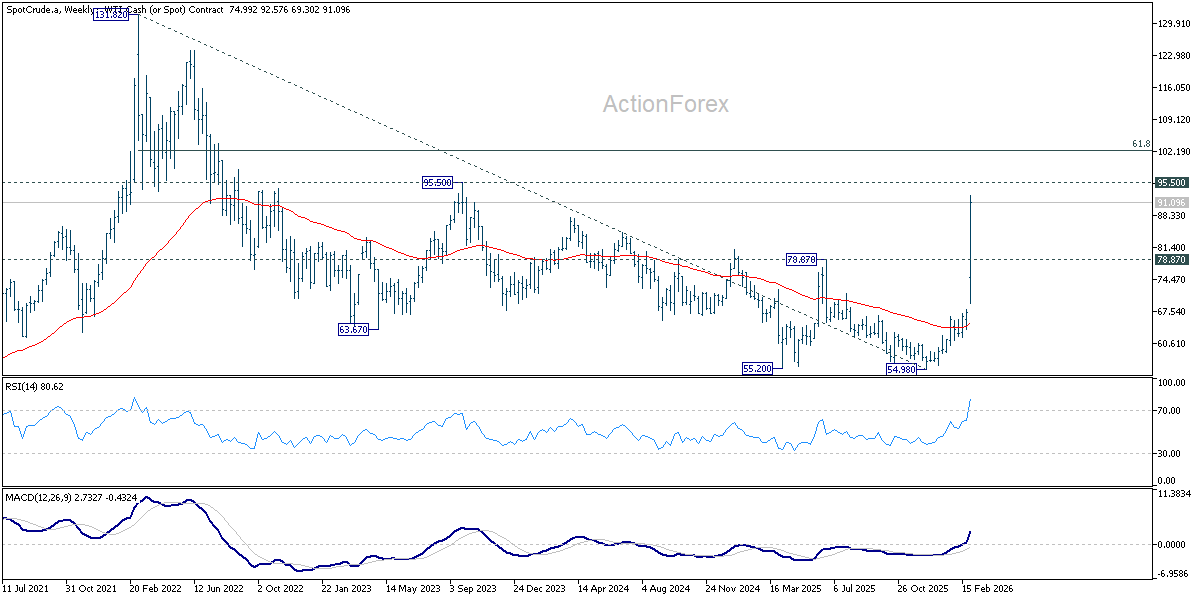
WTI’s break above the key 78.87 resistance level suggests that the market may be reversing the broader downtrend that began after the 2022 peak at 131.82. Momentum indicators now point toward further upside as long as this former resistance holds as support.
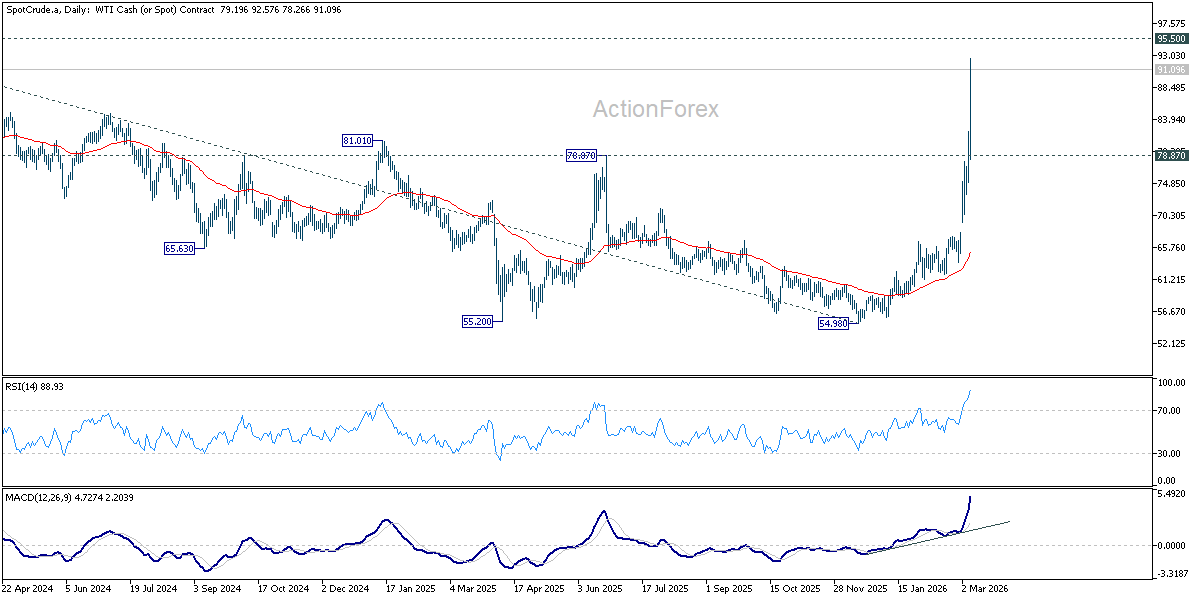
The next major technical zone lies between 95.50 structural resistance and 61.8% retracement of 131.82 to 54.98 at 102.46 . This area could act as a temporary brake on the rally as traders reassess the sustainability of the move.
However, decisive break above 102.46 would open the door for a much more aggressive advance, potentially placing the 2022 record high at 131.82 back within reach.
Rising Oil Prices Hammer DOW’s Industrial Core
While all major US equity indices ended the week lower, the Dow Jones Industrial Average bore the brunt of the selloff. The index dropped -3.01%, significantly underperforming broader benchmarks. The weakness highlights how the ongoing energy shock is affecting different parts of the market unevenly, with industrial and manufacturing-heavy sectors feeling the greatest strain.
Unlike technology-dominated indices such as Nasdaq, DOW is packed with companies whose profitability is tightly linked to fuel costs, global logistics, and capital spending cycles. Firms such as Caterpillar and Boeing sit directly at the intersection of rising energy prices and slowing global trade flows. When oil surges and geopolitical tensions disrupt supply chains, these businesses quickly come under pressure.
The effective closure of the Strait of Hormuz has therefore struck at the heart of DOW’s composition. Higher oil prices raise operating costs across transportation, manufacturing, and construction industries. At the same time, uncertainty around global trade discourages investment and capital spending—two key drivers of demand for many of the Dow’s largest constituents.
From a market psychology perspective, the selloff reflects more than just rising energy costs. Investors are beginning to contemplate the possibility that the Middle East conflict could evolve into a prolonged disruption to global supply chains. For industrial companies dependent on stable trade flows, such a scenario represents a meaningful deterioration in the macro outlook.
Technically, DOW’s strong break of the medium term rising channel floor should have confirmed medium term topping at 50512.79, on bearish divergence condition in D MACD. Current decline is seen as correcting the whole up trend from 36,611.78 (2025 low). Risk will stay on the downside as long as 55 D EMA (now at 48,799.58) holds. Next target is 38.2% retracement of 36,611.78 to 50,512.79 at 45,202.60.
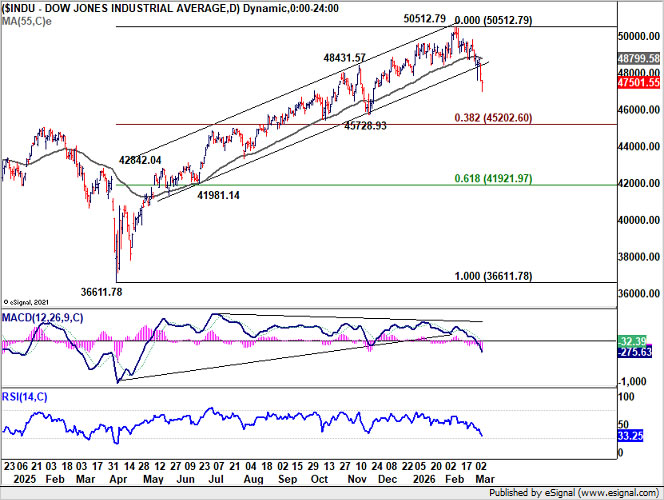
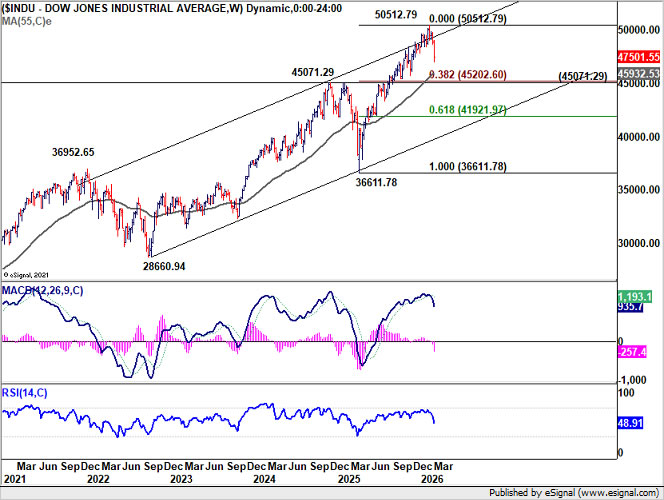
As seen in the weekly chart, that level coincides with 45,071.29 key resistance turned support (2024 high). This 45,000 region could become a major battleground for investors in the coming weeks. Strong support should emerge there to contain downside to bring rebound, at least on first attempt.
However, decisive break through 45,000 psychological level will argue that DOW is indeed reversing whole up trend from 36,611.78 rather than correcting it. That would open up further medium term fall towards long term channel floor (now at around 40,000.
Psychologically, 45,000 is massive. If the DOW breaks this, it signals that investors have moved from “this is a correction” to “we are entering a recessionary bear market.”
10-Year Yield Rebounds but Jobs Shock Caps the Surge
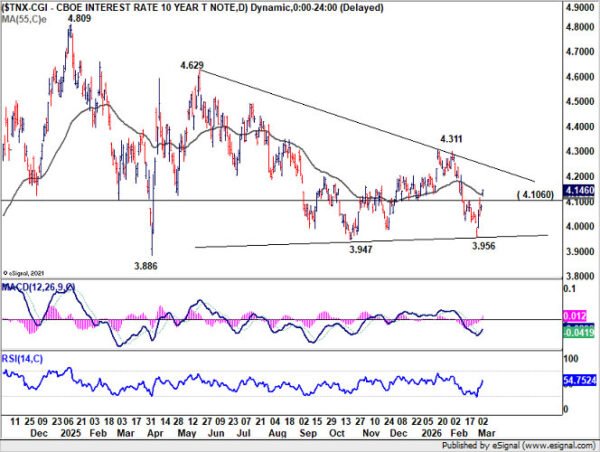
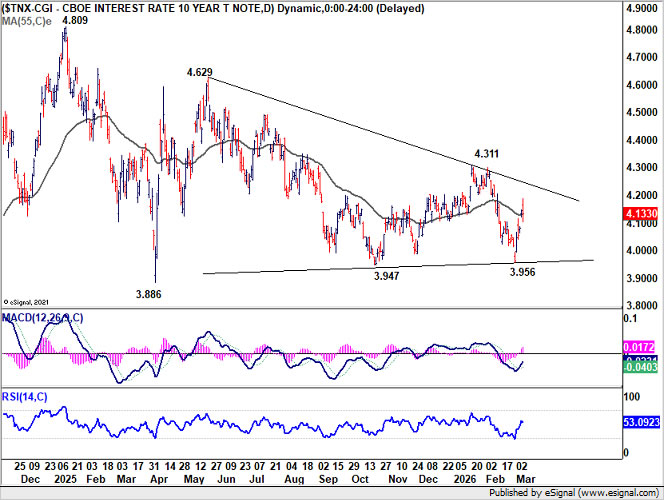
US Treasury yields staged a notable rebound last week as markets reacted to the inflationary implications of the ongoing energy shock. The benchmark 10-year yield climbed as high as 4.187 before easing to close at 4.133.
Normally, such a dramatic rise in crude prices would have pushed yields even higher. Energy shocks tend to lift inflation expectations, forcing bond markets to price in tighter monetary policy. However, the upside move in yields was capped by a surprisingly weak US labor market report.
February’s non-farm payroll data showed a shocking contraction of -92k jobs, a result that sharply contrasted with expectations for moderate job growth. The report signaled that the US labor market may be losing momentum, providing an important counterweight to the inflation risks posed by the oil surge.
This development prevented the bond market from facing a full “double shock” scenario. Without the weak payroll print, investors might have been forced to simultaneously price in higher inflation and a stronger economy—an outcome that could have sent yields surging sharply higher. Instead, the jobs data introduced a degree of caution into rate expectations.
As a result, expectations for Fed policy have shifted modestly. The possibility of a rate cut by the end of the first half of the year has returned to the discussion, although such an outcome will ultimately depend on how persistent the oil-driven inflation pressures prove to be.
Technically, the medium-term outlook for the 10-year yield has shifted from mildly bearish to neutral. The yield remains trapped within the converging triangle pattern that has been developing since mid-last year, suggesting that range trading between roughly 3.956 and 4.311 may continue until a clearer macro catalyst emerges.
Rising Risk Aversion and Steady Yields Could Trigger Dollar Index Bullish Turn
Dollar Index staged a notable rebound last week as global markets turned increasingly defensive. The combination of risk aversion and stabilizing yields has created conditions for a potential bullish reversal in Dollar Index’s medium term trend. Additionally, Dollar Index is drawing support from the multi-decade channel floor, which could provide a base for a bull run.
Technically, the key lies in a critical resistance cluster that could determine the next medium-term move. This zone includes the 55 W EMA near 99.59, structural resistance around 100.39, and the 38.2% retracement of 110.17 to 95.55 at 101.13.
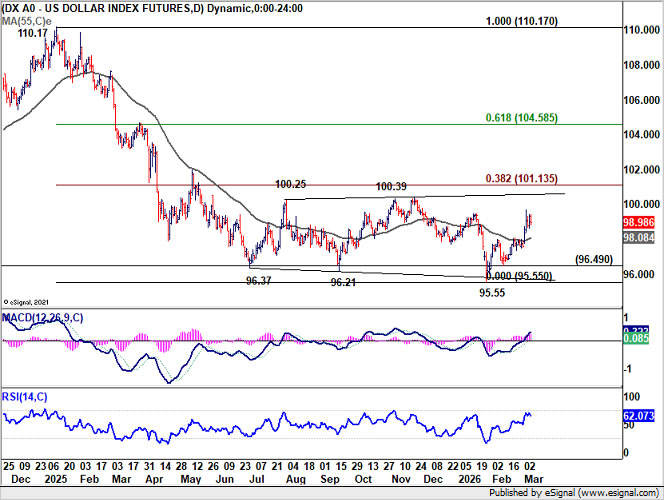
Decisive break through the 100–101 resistance region would provide strong confirmation that Dollar Index is entering a new bullish phase. Such a move would open the door for rally toward 61.8% retracement at 104.58.
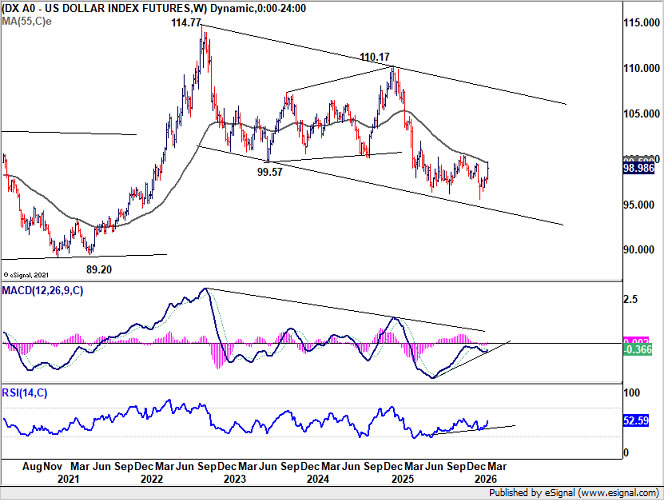
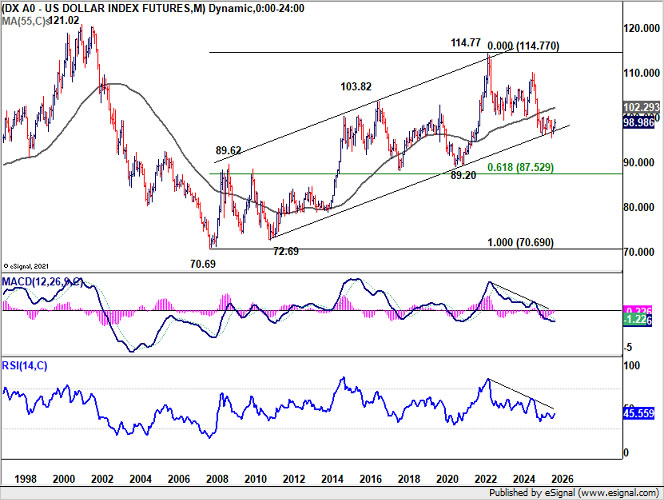
Beyond that, Dollar could potentially extend its advance toward the upper boundary of its long-term descending channel, which currently lies near 108 region on the weekly chart.
For now, however, the bullish case remains conditional. Dollar must first break convincingly through the heavy resistance zone of 100-101 before a sustained uptrend can take hold.
Energy Exporter vs Importer Trade Hits EUR/CAD
Among the major currency moves of the week, EUR/CAD stood out as the clearest reflection of the global energy shock. The cross dropped around -2.25%, making it the Top Mover as markets rapidly repriced the divergent impact of surging oil prices on the Canadian and Eurozone economies.
The logic behind the move is straightforward. Canada is one of the world’s major energy exporters, and higher oil prices typically strengthen the Canadian Dollar as export revenues rise and the country’s terms of trade improve. In times of energy shocks, investors often treat the Loonie as a liquid proxy for oil itself.
The current geopolitical crisis has amplified this relationship. As WTI crude surged toward and beyond USD 90 per barrel, the value of Canada’s stable energy exports increased in relative terms. For global investors searching for exposure to energy-producing economies without the political risks of the Middle East, Canada stands out as a reliable alternative.
By contrast, the Eurozone sits on the opposite side of the energy equation. The region remains heavily dependent on imported energy, making it particularly vulnerable to sudden increases in oil and gas prices. When crude prices surge, the impact on Europe is similar to a broad-based tax on consumers and industrial producers.
Higher energy costs raise input prices for manufacturers, squeeze household spending power, and complicate the policy outlook for the ECB. In such an environment, investors begin to price in the risk that Europe could face a renewed bout of stagflation—slowing growth combined with persistent inflation.
The equity market reaction in Europe reinforced this narrative. Germany’s DAX, home to many of the continent’s largest industrial exporters, was among the worst-performing indices as investors assessed the potential impact of sustained energy disruptions on Europe’s industrial base.
This widening divergence between energy exporters and energy importers is now clearly visible in the EUR/CAD exchange rate. As oil prices climbed and risk aversion intensified, capital flowed toward Canadian Dollar while Euro struggled to find support.
Technically, after last week’s steep decline, the immediate focus for EUR/CAD is now on 38.2% retracement of 1.4483 to 1.6465 at 1.5708. Some support could be found there to bring a near term recovery. Though, risk will stay on the downside as long as 1.6063 support turned resistance holds.
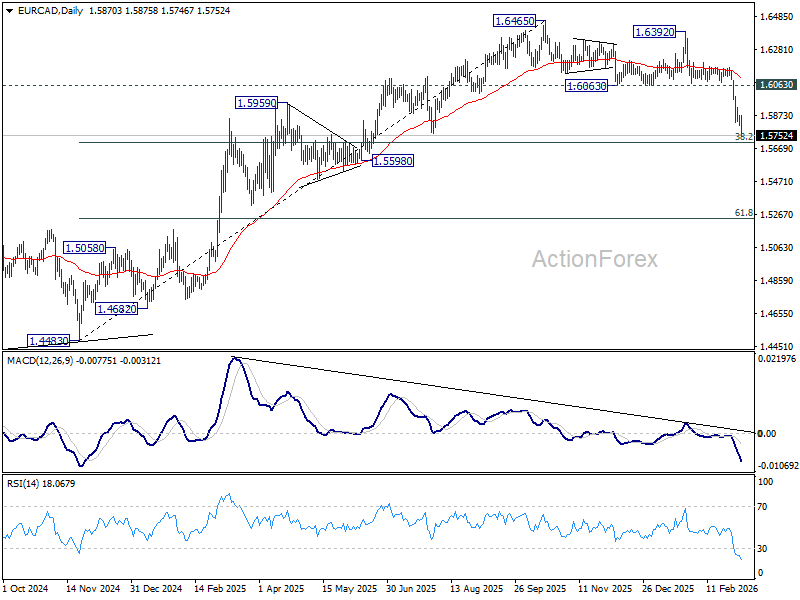
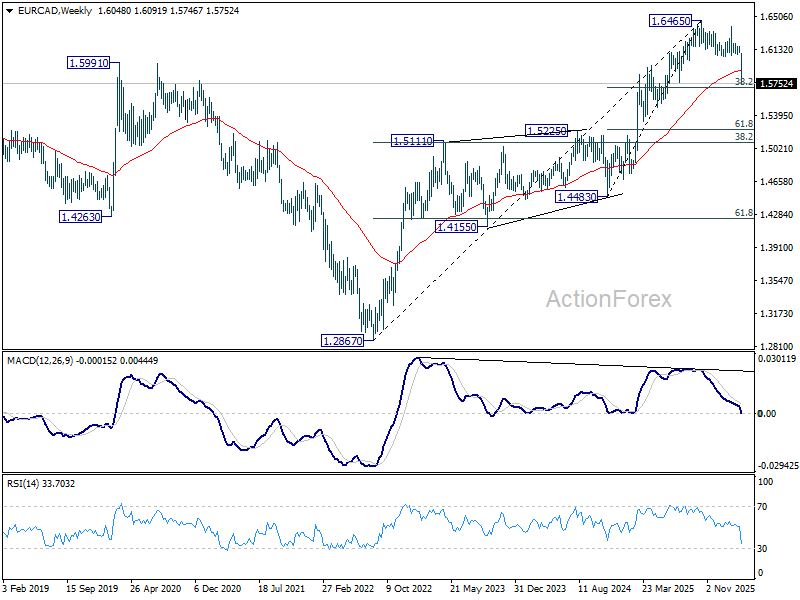
However, decisive break of 1.5708 will raise the chance that EUR/CAD is indeed correcting a larger scale up trend from 1.2867 (2022 low). That would happen if the Middle East conflicts prolong further, with WTI oil sustains at elevated levels above 100.
In this bearish scenario, that would setup EUR/CAD for a medium term decline to 1.5111 cluster support, with 38.2% retracement of 1.2867 to 1.6465 at 1.5091.
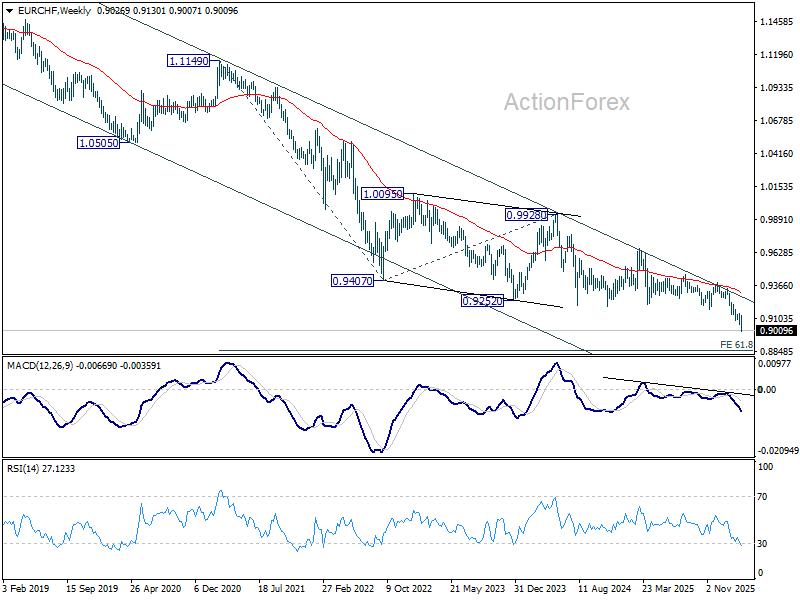
EUR/CHF Weekly Outlook
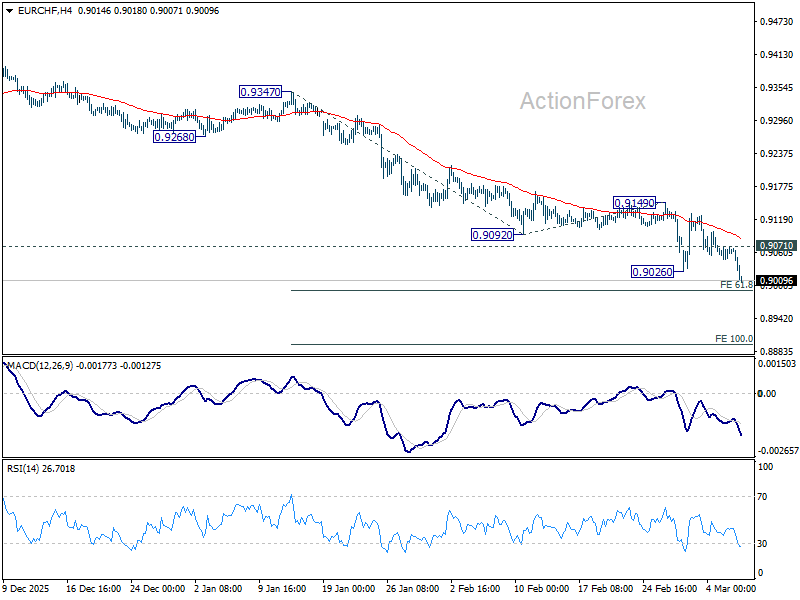
EUR/CHF’s down trend resumed by late break of 0.9092 support last week. Initial bias is back on the downside. Next target is 61.8% projection of 0.9347 to 0.9092 from 0.9149 at 0.8991. For now, near term outlook will stay bearish as long as 0.9149 resistance holds, in case of recovery.
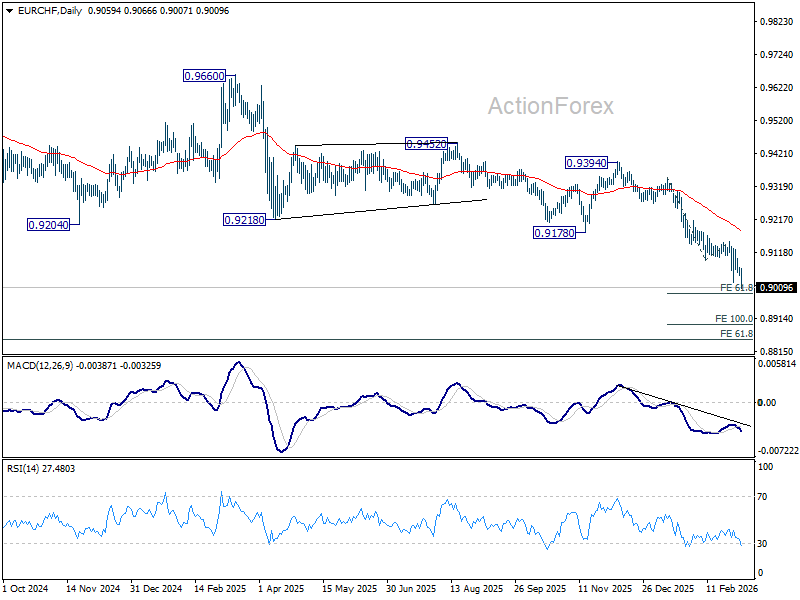
In the bigger picture, down trend from 0.9928 (2024 high) is still in progress. Next target is 61.8% projection of 1.1149 to 0.9407 from 0.9928 at 0.8851. Outlook will stay bearish as long as 0.9394 resistance holds, in case of rebound.
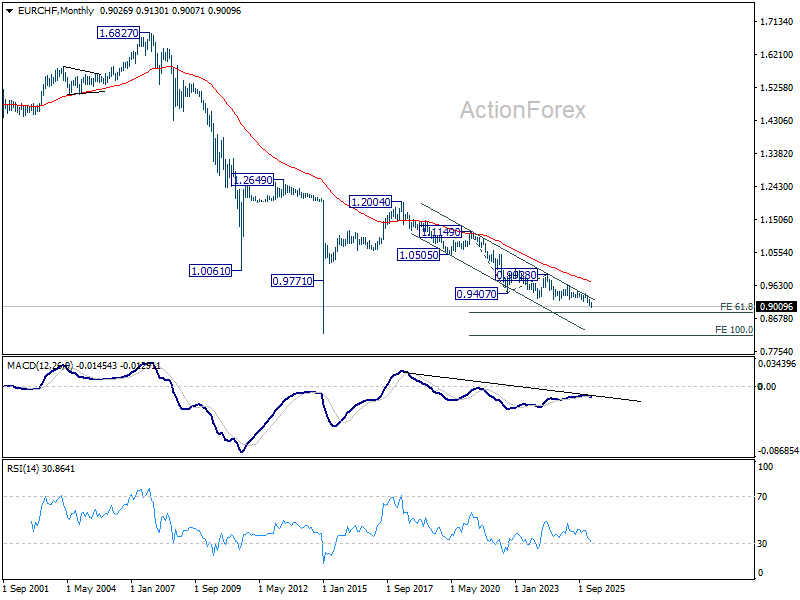
In the long term picture, EUR/CHF is also holding well inside long term falling trend channel. Down trend from 1.2004 (2018 high) is still in progress. Outlook will continue to stay bearish as long as falling 55 M EMA (now at 0.9739) holds.