DKosig/iStock via Getty Images
“Be careful what you wish for, lest it come true.”—Aesop
Why didn’t we do better when value outperformed?
For several quarters, we’ve highlighted that market gains have been dominated by momentum and growth. Stocks that were rising kept rising, while laggards fell further behind. This created a historically wide gap in P/E multiples between our portfolio and the S&P 500—and, more importantly, left Oakmark Fund’s P/E well below even that of the Russell 1000 Value Index.
Our conclusion was straightforward: since we were “more value” than the value indices, Oakmark should shine when the Russell Value eventually outperformed the S&P. It finally outperformed last quarter: the S&P 500 declined more than 4% while the Russell 1000 Value rose by over 2%. Did Oakmark outperform the value index as expected? No. We did better than the S&P but still declined. What happened?
Typically, when the Russell Value outperforms, it’s because low P/E stocks beat high P/E stocks. Since we believed the premium investors were paying for high-growth companies exceeded what fundamentals justified, we expected lower P/E stocks to outperform. But that’s not what occurred last quarter.
To understand why, consider how the Russell 1000 Growth and Value indices are constructed. Companies are ranked by price-to-book and expected two-year growth. Lower price and growth are called value; higher price and growth are called growth. The top 50% of market cap becomes the growth index, and the rest becomes the value index (with some companies in both). Because higher-growth stocks have recently outperformed, the number of companies in the growth index has shrunk. As a result, many high multiple, above-average growth businesses have been pushed into the value index.
These higher-growth, higher-P/E stocks drove the Russell Value’s strong first-quarter performance. For example, the Index’s semiconductor-related stocks, which ended 2025 with an average forward P/E of 29, increased 15% and accounted for a large share of the index’s return. Within the Russell Value, the highest P/E quintile outperformed the lowest by 390 basis points (+3.5% vs. -0.4%). This was clearly not the low P/E rebound we anticipated. Instead, the spread between high and low P/E stocks widened further—despite already being historically large. Our portfolios remain positioned for that spread to narrow, an opportunity we believe is even more compelling today.
We were very active, active managers last quarter
As long-term investors, we typically hold stocks for about five years—the time it usually takes for our view of value to converge with the market’s. While overall turnover is inflated by position size management and tax trading, Oakmark Fund’s name turnover has averaged about 20% annually. With 50–60 holdings in Oakmark Fund, that implies fewer than three new positions per quarter. Last quarter, we added eight—triple the average and the most since the dot-com crash. Why now?
Broad market moves don’t necessarily expand our opportunity set. When most stocks rise or fall together, relative attractiveness changes little. Opportunities grow when performance diverges—allowing us to sell stocks near our value estimates and reinvest in those trading well below them.
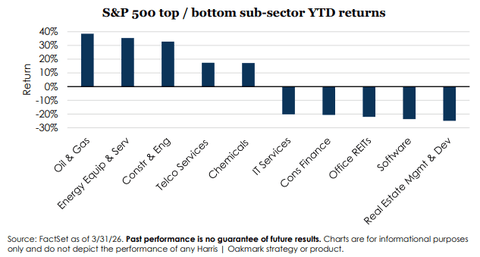
That divergence was extreme last quarter: the 50 th -best stock in the S&P 500 outperformed the 450 th -best by 44 percentage points, a divergence not seen since the Covid shutdown in 2020. Sector dispersion was similarly wide. Energy stocks rose sharply while software declined. Accordingly, we sold primarily in energy and industrials and redeployed capital primarily into software and financials.
When we evaluate potential trades, our goal is to improve the portfolio by making it cheaper, higher growth, or lower risk. By our estimates, last quarter’s trades achieved all three. Our buys had lower P/Es but higher expected growth than our sells. They also had lower historical correlation with the portfolio, meaning we expect the new positions to slightly reduce portfolio volatility. It’s common to improve one metric without hurting the others; improving all three is rare.
Portfolio repositioning
Source: FactSet as of 3/31/26. The P/E ratio shown is the dollar-weighted average of security-level NTM price-to-earnings for all new buys and adds where the share amount increased by at least 25%. This same approach is applied for final sales and trims, capturing those that decreased share count by 25% or more. For EPS Growth, an identical dollar-weighted calculation is used. Both the security-level P/E ratios and EPS statistics are sourced from FactSet’s forward-looking mean consensus estimates. For each group, average correlation is calculated as the dollar-weighted average of the trailing one-year correlation of each security to the portfolio, based on daily returns measured through 3/31/2026.
The importance of price
I’ll close with a reminder of how critical the price paid is to future returns. For most of the period following the Great Financial Crisis, investors have been rewarded for ignoring price, buying great businesses outperformed buying great values. This drove a historically wide gap between the “haves” and “have-nots.” If we’re right that the P/E gap has become unsustainably wide, simply buying better businesses regardless of price will no longer be effective.
AI has been a common concern driving down prices across our recent purchases: fears that it will replace financial advisors, insurance brokers, and even software and entertainment providers. Interestingly, the companies we’ve invested in expect AI to enhance—not diminish—their businesses. While that debate will take time to resolve, one thing is certain: stock prices have changed.
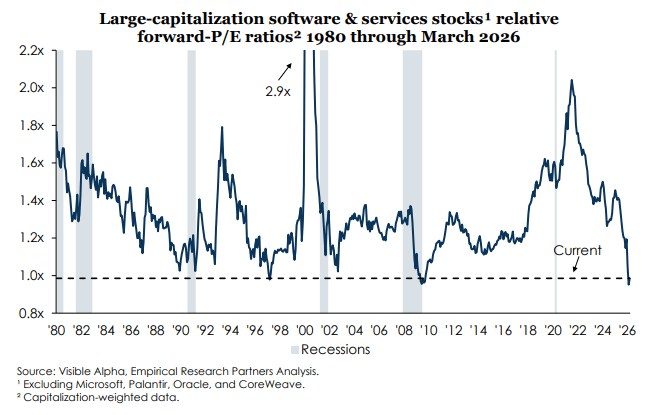
As shown in the above chart from Empirical Research, software stocks are trading cheaper than the S&P 500, their lowest ever relative P/E. At their 2021 peak relative multiple, more than double the Index, fundamental performance needed to be far superior just to produce average stock performance. Investors needed to ask, “Are the businesses really that good?”
With AI uncertainty now at least partly reflected via lower prices, we believe the risk/reward has improved significantly. Consider that the software stocks in Oakmark Fund now trade nearly 30% cheaper than average industrial stocks. This reframes the question: “Are software businesses so much worse than industrials that they deserve such a large discount?” We believe the answer is an emphatic no, especially considering their much higher expected growth. When stock prices change, the questions investors need to answer also change.
Stepping into controversy after sharp declines is nothing new for Oakmark. It doesn’t guarantee success, but it has been central to our approach and long-term results. It’s also a key reason why, in an industry where firms often come and go, Harris | Oakmark is celebrating its 50th anniversary this year.
We appreciate the trust you place in us to help achieve your family’s financial goals, and we remain invested alongside you.
William C. Nygren, CFA
Portfolio Manager
Harris | Oakmark
Oakmark Fund – Investor Class
Average Annual Total Returns (03/31/2026)
Since Inception (08/05/1991) 12.68%
10-year 13.50%
5-year 11.21%
1-year 10.04%
3-month -2.47%
Expense Ratio: 0.89%
Expense ratios are as of the Fund’s most recent statutory prospectus dated January 28, 2026, as amended and restated April 2, 2026; actual expenses may vary. Returns for periods of less than one year are not annualized.
Past performance is no guarantee of future results. The performance data quoted represents past performance. Current performance may be lower or higher than the performance data quoted. The investment return and principal value vary so that an investor’s shares when redeemed may be worth more or less than the original cost. To obtain the most recent month-end performance data, visit Oakmark.com .
Editor’s Note: The summary bullets for this article were chosen by Seeking Alpha editors.