NZD/USD Technical Outlook: Bulls Stare Down Major Resistance, Bullish Bias Hinges on the 0.5821 Pivot

  • The NZD/USD is currently facing its sternest technical test at the 0.5918–0.5920 resistance zone
  • The Daily chart suggests a potential long-term trend shift, but the H4 RSI shows bearish divergence, signaling short-term exhaustion.
  • A clean break above 0.5920 would accelerate the move toward 0.5950.
  • Inability to hold the level, followed by a break below 0.5873, risks a corrective slide back to the major support pivot at 0.5821.

The New Zealand Dollar may be about to face its sternest test yet. The pair has to grapple with a cluster of technical resistance levels around the 0.5918-0.5920 zone, the question for the upcoming session is whether the bulls have enough fuel left in the tank for a structural breakout or if we are due for a “mean reversion” back toward 0.5820.

Daily Chart: The Descending Trendline Challenge

The macro view on the daily chart reveals a pair attempting to break free from a long-term bearish regime. After a sharp sell-off in early 2026, NZD/USD has formed a classic “V-shaped” recovery, slicing through the first major obstacle at 0.5821.

Currently, spot prices are knocking on the door of the 0.5918 resistance level. A daily close above this confluence would signal a significant trend shift, potentially opening the door for a move toward the 0.6100 handle.

However, the Daily RSI at 56.4 shows that while momentum is positive, the pair is far from overbought, suggesting that there is still “white space” for bulls to exploit if the breakout is confirmed.

NZD/USD Daily Chart, April 16, 2026
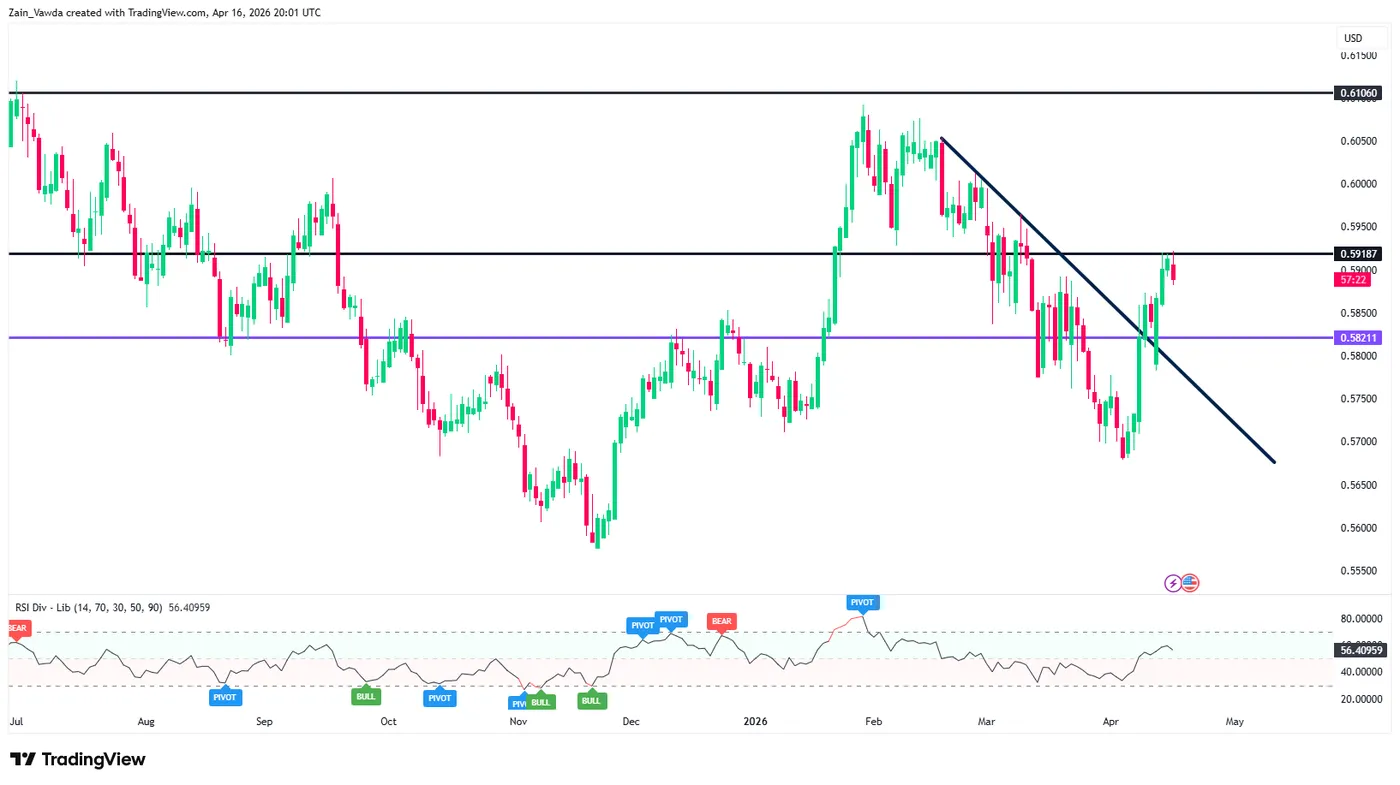
Source: TradingView

H4 Chart: RSI Divergence Flags Exhaustion

Zooming into the H4 timeframe, the bullish structure remains intact, characterized by a series of higher highs and higher lows. The pair may find support at the 0.5870 – 0.5850 zone, which previously acted as a cap.

However, a note of caution for the bulls: the H4 RSI has printed multiple “BEAR” pivot warnings at the recent peaks near 0.5920. This bearish divergence suggests that the “easy money” on the long side may have been made, and the pair might need a period of consolidation or a slight pullback to gather strength before its next impulsive leg.

NZD/USD Four-Hour Chart, April 16, 2026
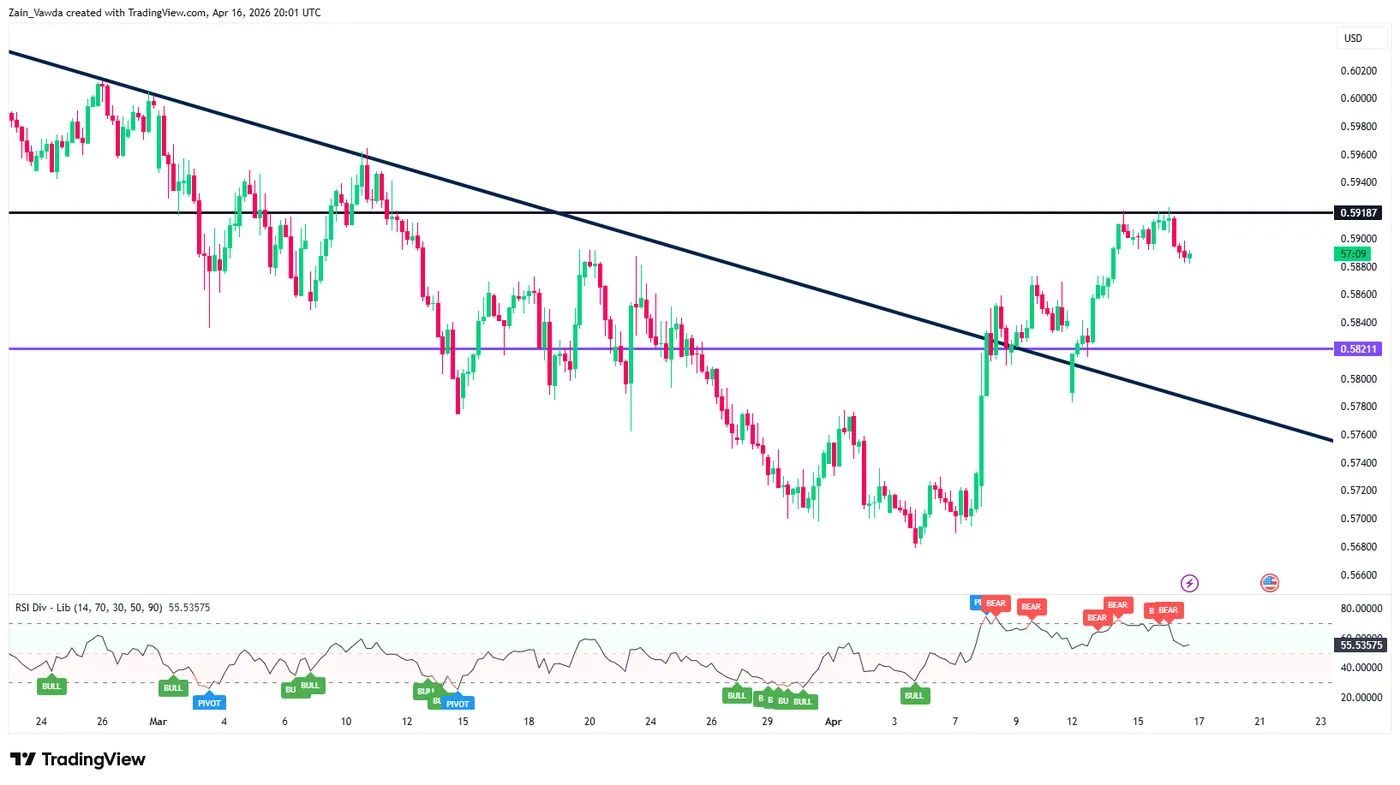
Source: TradingView

H1 Chart: Session Scenarios & Key Levels

The hourly chart provides a clear roadmap for the upcoming session, showing the pair currently trading around 0.5892 after a slight rejection from the 0.5918 ceiling.

The Bullish Scenario

For the rally to resume, the Kiwi needs to hold above the intraday support at 0.5873. If buying pressure returns, a clean break above 0.5920 would likely trigger stops from short-sellers, potentially leading to an accelerated move toward 0.5950 and 0.5980. Traders coul look for a “bull flag” consolidation pattern on the M30 or M15 as a precursor to this move.

The Bearish Scenario

The inability to hold above the 0.5920 level is the first warning sign. If we see a break below 0.5873, it would likely confirm a “double top” on the lower timeframes. This could trigger a corrective slide back toward the major support pivot at 0.5821, where the long-term descending trendline might be retested from the “top side.”

Key Levels to Watch:

  • Resistance: 0.5918 (Major), 0.5950, 0.6000
  • Support: 0.5873, 0.5821 (Pivot), 0.5780

NZD/USD One-Hour Chart, April 16, 2026
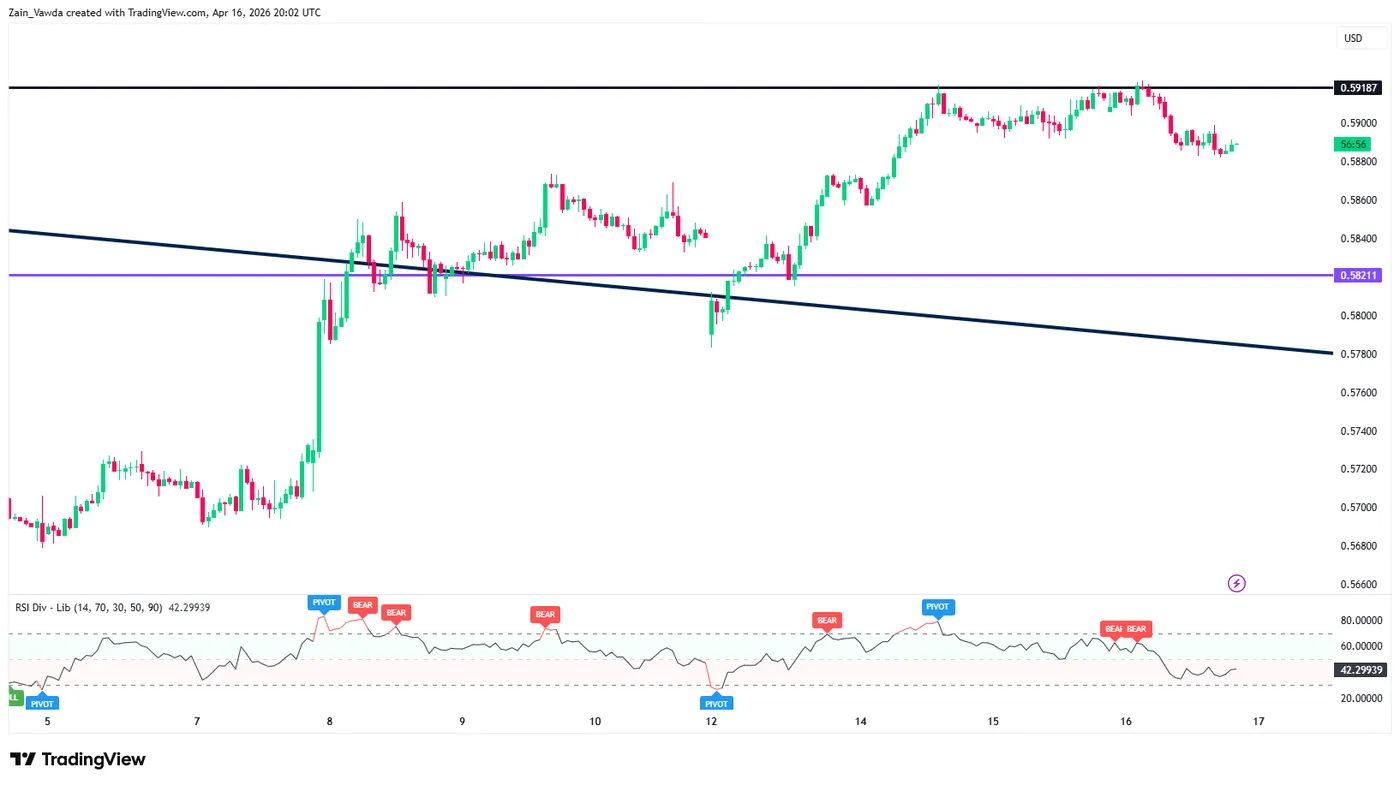
Source: TradingView

NZD/USD is at a critical technical junction. While the daily structure is turning constructive, the short-term indicators are screaming for a breather. As long as the 0.5821 level holds on a closing basis, the bullish bias remains the dominant theme.

Source link

Visited 1 times, 1 visit(s) today

Related Article

EUR/GBP Daily Outlook - ActionForex

EUR/GBP Daily Outlook – ActionForex

Daily Pivots: (S1) 0.8657; (P) 0.8680; (R1) 0.8693; More… Intraday bias in EUR/GBP is back on the downside with break of 0.8675 support. Rebound from 0.8610 could have completed at 0.8740 already. Deeper fall would be seen back to retest 0.8610 low. On the paused, above 0.8692 minor resistance will turn intraday bias neutral again

Nasdaq Breaks a New Record after Ceasefire Extension – Dow Jones and US Stock Market Outlook

Nasdaq Breaks a New Record after Ceasefire Extension – Dow Jones and US Stock Market Outlook

US Stock Benchmarks corrected yesterday from a reappearing angst regarding the Ceasefire and Kevin Warsh’s hawkish hearing Donald Trump saved the day by announcing yet another short-term extension to the Ceasefire Exploring Technical Levels for the Dow Jones, Nasdaq and S&P 500 US stock benchmarks experienced a sharp correction yesterday, dragged down by reappearing angst

Bitcoin Extends Gains, Can Bulls Drive A Larger Rally?

Bitcoin Extends Gains, Can Bulls Drive A Larger Rally?

Key Highlights Bitcoin started a fresh increase above $75,000 and $76,500. A bullish trend line is forming with support at $76,000 on the 4-hour chart of BTC/USD. Ethereum also climbed over 5% and surpassed $2,400. Gold is consolidating below the $4,850 resistance. Bitcoin Price Technical Analysis Bitcoin price remained supported above $74,000 against the US

EUR/CHF Daily Outlook - ActionForex

EUR/CHF Daily Outlook – ActionForex

Daily Pivots: (S1) 0.9157; (P) 0.9174; (R1) 0.9186; More…. Intraday bias in EUR/CHF remains neutral and range trading continues below 0.9264. Further rise is in favor with 0.9155 support intact. Firm break of 0.9264 will resume the rise from 0.8979 to 0.9394 resistance next. However, break of 0.9155 will turn bias back to the downside

gbpusd2204crispus.jpeg

Extremely Bullish Outlook Ahead of UK CPI Data (chart)

Created on April 22, 2026 Bullish view Bearish view The GBP/USD exchange rate wavered as market participants reacted to the latest UK jobs report and Kevin Warsh’s confirmation hearings in Washington. It was trading at 1.3510 on Wednesday as focus shifted to the upcoming UK inflation report. UK Consumer Inflation Report and Kevin Warsh Confirmation

usdsgd2204crispus.jpeg

On the Cusp of a Bearish Break (chart)

Created on April 22, 2026 The USD/SGD exchange rate has remained under pressure in the past few weeks as the US dollar has softened recently. It was trading at 1.2725 on Wednesday, down from the year-to-date high of 1.2925. Singapore Dollar Gains as the Greenback Slips The USD/SGD exchange rate has remained in a downward

xauusd-220426mahmoud.png

Bearish Bias Holds Below $4850

Created on April 22, 2026 Today’s Gold Analysis Overview: The Overall Gold Trend: Bearish. Today’s Gold Support Points: $4690 – $4630 – $4570 per ounce. Today’s Gold Resistance Points: $4780 – $4830 – $4885 per ounce. Today’s Gold Trading Signals: Note: These recommendations are suitable for medium-to-long-term traders, provided there is strict adherence to capital

USD/JPY Pulls Higher: Yen Doubts Bank of Japan

USD/JPY Pulls Higher: Yen Doubts Bank of Japan

USD/JPY climbed to 159.36 mid-week, with the Japanese yen losing ground for a second consecutive day. The market is pricing in the Bank of Japan’s policy outlook ahead of next week’s meeting. The regulator is likely to keep rates unchanged while continuing to analyse the impact of the Middle East conflict on the economy. At

Split Personality Markets: Stocks Up, Oil Warns, Dollar Torn

Split Personality Markets: Stocks Up, Oil Warns, Dollar Torn

Markets are showing a clear “split personality” right now. Equities are pushing higher on the back of the extended US–Iran ceasefire, while oil continues to signal caution and Dollar is caught between opposing forces. The result is a fragmented picture where no single macro narrative is dominating. US futures are trading higher after President Donald

Republicans are Indirectly Backing a Tougher Fed Policy

Republicans are Indirectly Backing a Tougher Fed Policy

Congress is in no hurry to confirm Warsh. US-Iran talks have broken down. The US dollar has launched a counter-offensive thanks to the breakdown of US-Iran talks and a 1.7% month-on-month rise in retail sales in March. The economy is strong, oil prices are high and could rise even further, whilst the futures market is

USD/JPY Daily Outlook - ActionForex

USD/JPY Daily Outlook – ActionForex

Daily Pivots: (S1) 158.80; (P) 159.28; (R1) 159.87; More… Intraday bias in USD/JPY stays neutral as consolidation continues below 160.45. Further rise is expected with 157.49 cluster support (38.2% retracement of 152.25 to 160.45 at 157.31) intact. On the upside break of 160.45 will target a retest on 161.94 high. However, firm break of 157.31/49

Gold and Silver Recover as US Extends Iran Ceasefire, But Technical Weakness Emerges

Gold and Silver Recover as US Extends Iran Ceasefire, But Technical Weakness Emerges

Gold and Silver stabilized after the US extended the Iran ceasefire, cushioning markets from immediate escalation fears and preventing a deeper selloff. The move offset earlier weakness triggered by the cancellation of JD Vance’s planned diplomatic trip. However, technical developments suggest both metals are becoming increasingly vulnerable to a near-term bearish reversal, with selling likely

Gold Stabilizes, Market Prepares For Next Decisive Move

Gold Stabilizes, Market Prepares For Next Decisive Move

Key Highlights Gold started a fresh increase above the $4,700 zone. A key contracting triangle is forming with resistance at $4,900 on the 4-hour chart. WTI Crude Oil tested $83.00 and recently recovered some losses. EUR/USD failed to stay above 1.1820 and corrected gains. Gold Price Technical Analysis Gold reclaimed the $4,550 pivot level and

14 cheated of Rs 2cr in forex trading lure; 3 of family booked

14 cheated of Rs 2cr in forex trading lure; 3 of family booked | Surat News

Surat: Three members of a family allegedly cheated at least 14 people of Rs 2.05 crore after luring them with promises of high returns from forex trading.Three accused members of a family, including a woman, allegedly cultivated trust among locals by frequently visiting a temple in Dabholi and projecting an image of wealth. They would

CHFJPY Achieves New Highs from Blue Box Zone

CHFJPY Achieves New Highs from Blue Box Zone

In this technical blog, we will look at the past performance of the 4-hour Elliott Wave Charts of CHFJPY. In which, the rally from September 2024 low is unfolding as an impulse sequence. Therefore, called for more upside to take place. We knew that the structure in the pair should remains incomplete & should see

Dollar Forecasting Tougher Times Ahead – EUR/USD, AUD/USD & Dollar Index (DXY) Overview

Dollar Forecasting Tougher Times Ahead – EUR/USD, AUD/USD & Dollar Index (DXY) Overview

The US Dollar has corrected quite severely since the announcement of the two-week ceasefire, and not without good cause. The infamous Petrodollar trade has gripped financial markets on all sides since the beginning of the US-Iran-Israel conflict, particularly amid the rise in Crude Oil to 4-year highs. The USD has historically held a decent correlation

xauusd-210426mahmoud.jpeg

Bearish Bias Ahead of Potential US-Iran Talks (chart)

Created on April 21, 2026 Today’s Gold Analysis Overview: The Overall Gold Trend: Neutral with a bearish bias. Today’s Gold Support Points: $4765 – $4720 – $4680 per ounce. Today’s Gold Resistance Points: $4830 – $4880 – $4925 per ounce. Today’s Gold Trading Signals: Note: These recommendations are suitable for medium-to-long-term traders, provided there is

US Retail Sales Surge 1.7% mom in March, Core Spending Signals Resilient Demand

US Retail Sales Surge 1.7% mom in March, Core Spending Signals Resilient Demand

US retail sales rose 1.7% mom to USD 752.1B in March, beating expectations of 1.3% mom and pointing to stronger-than-anticipated consumer demand. Ex-auto sales climbed 1.9% mom to USD 612.4B, also above forecasts of 1.3% mom. However, the composition shows a more nuanced picture. Sales excluding both autos and gasoline rose just 0.6% mom, indicating

0
Would love your thoughts, please comment.x
()
x