By Lance Roberts | March 9, 2024

Inside This Week’s Bull Bear Report
- Is This A Market Top Or A Bubble?
- How We Are Trading It
- Research Report –Dumb Money Investors At It Again
- Youtube – Before The Bell
- Market Statistics
- Stock Screens
- Portfolio Trades This Week
Bull Trend Of Market Continues Uninterrupted
Last week, the ongoing “can’t stop, won’t stop” bullish trend remained firmly intact. As we noted then:
“That remains the case this past week. While the overall market traded higher into the end of the week, setting new all-time highs, the bullish November trend remains intact. While the market remains confined to that narrow rising trend channel, the MACD “buy signal” remains elevated, and an apparent deterioration in the market’s momentum remains.”
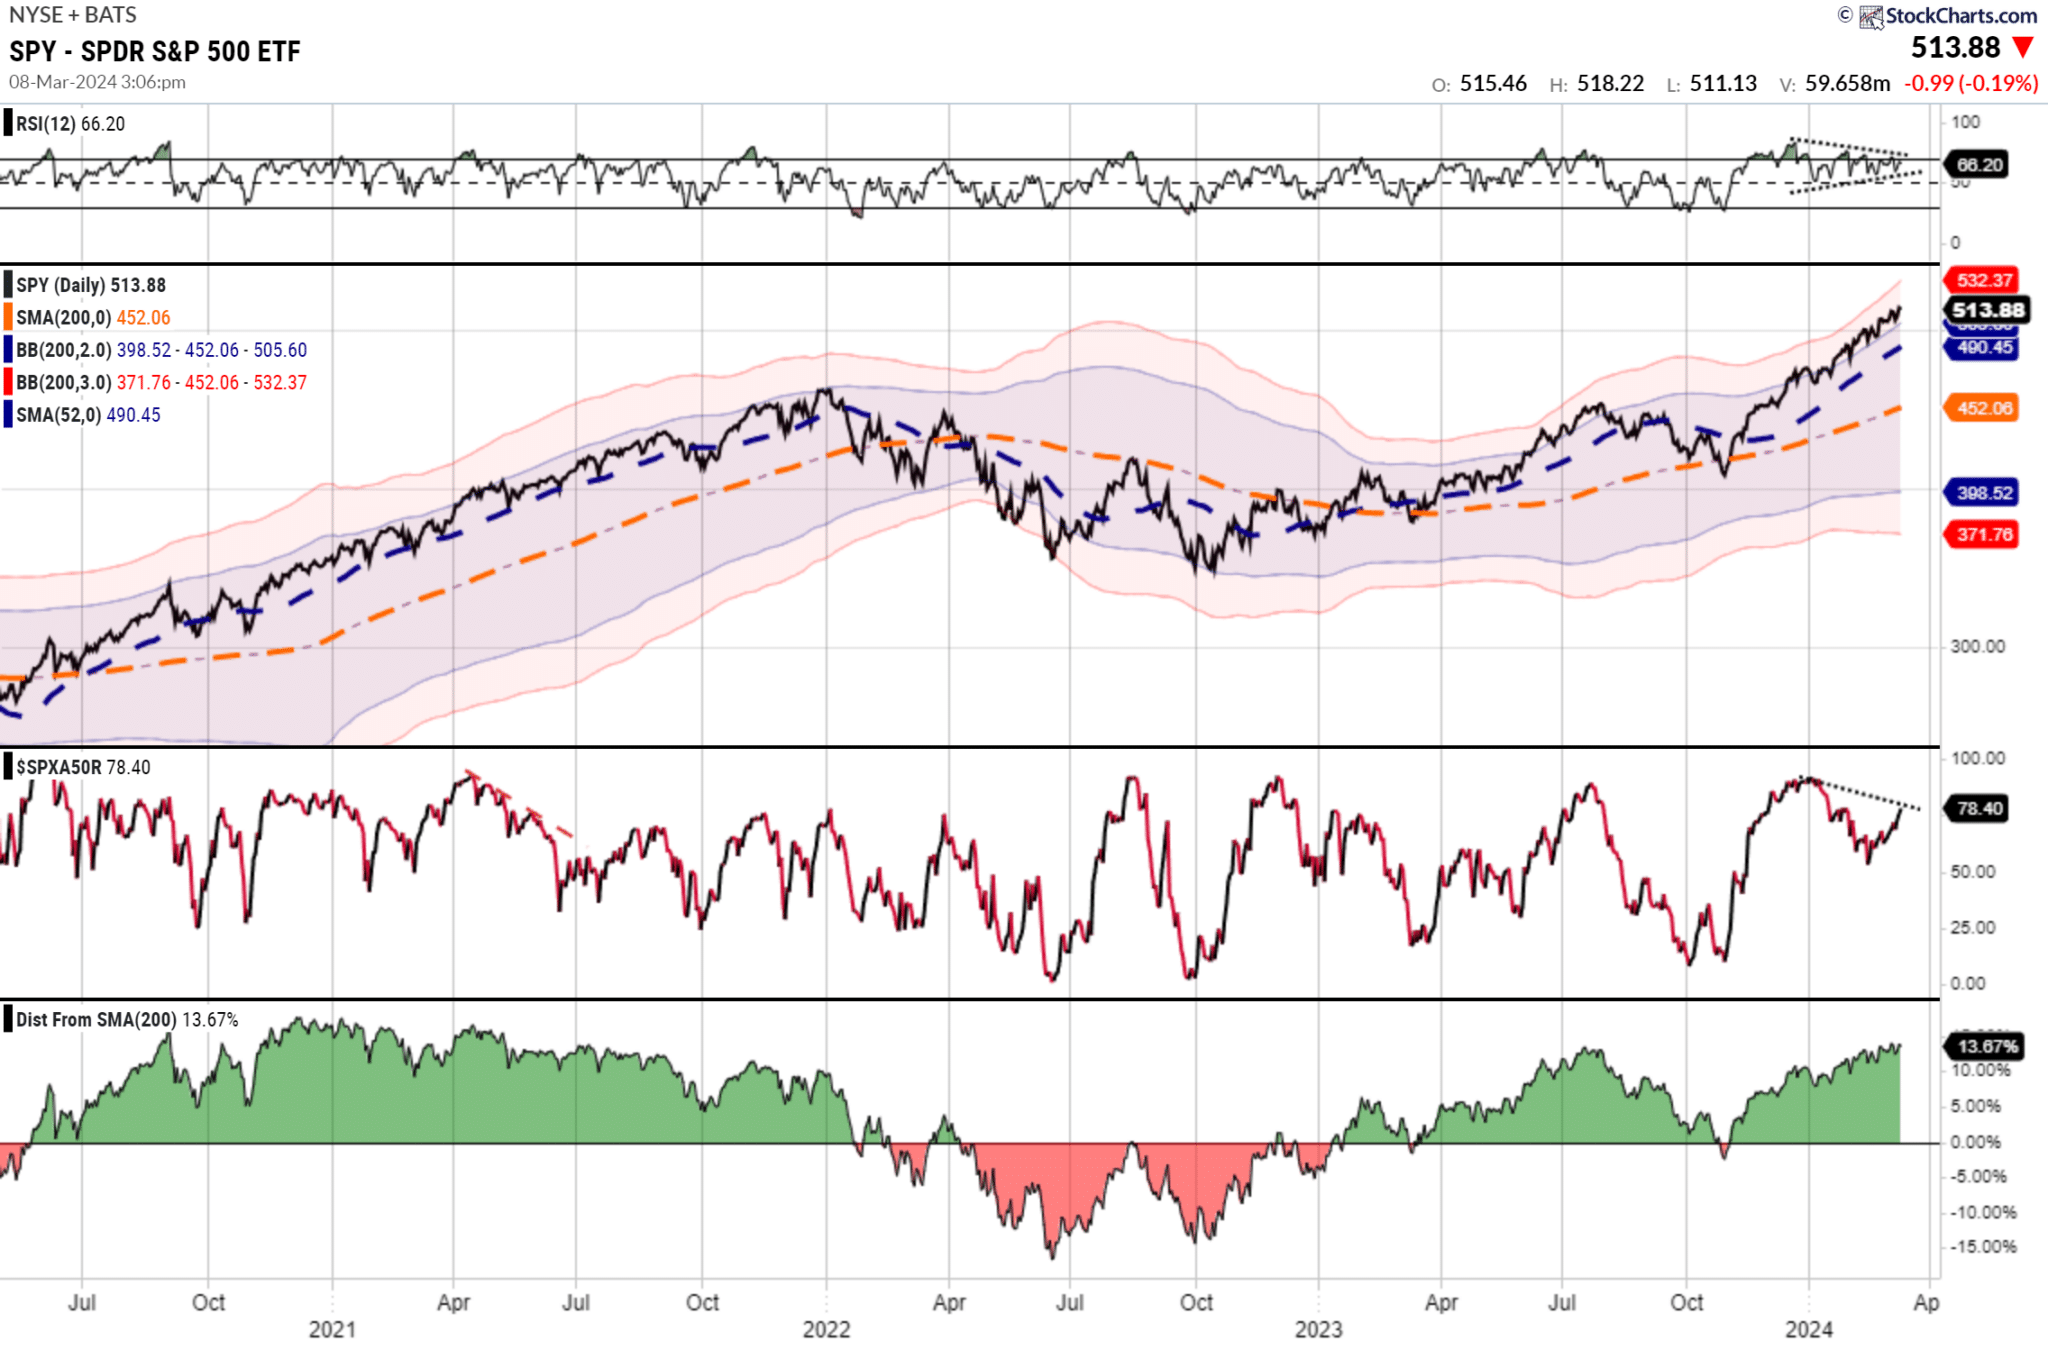
That was the case again this week, as the market tested the 20-DMA, the bottom of the trend channel, early in the week, which sparked buyers to push the index to all-time highs by the week’s end. At the same time, volatility remains compressed, with the deviation from the 200-DMA growing. As shown, the breadth of the market and momentum are both negatively diverging from the rising market, which historically serves as a warning.
While we have become increasingly cautious over the last few weeks, as the market continues to rise, we have suggested taking profits and rebalancing portfolio risks. If you have not done so, such remains a recommended course of action. However, this does not mean to reduce equity allocations aggressively.
As noted, the market remains in a bullish trend. The 20-DMA, the bottom of the trend channel, will likely serve as an initial warning sign to reduce risk when it is violated. That level has repeatedly seen “buying programs” kick in and suggests that breaking that support will cause the algos to start selling. Such a switch in market dynamics would likely lead to a 5-10% correction over a few months. We will reduce equity positioning and aggressively implement hedging strategies at that point.
However, the question we have been asked most this week is, “Are we in a market bubble?”
Need Help With Your Investing Strategy?
Are you looking for complete financial, insurance, and estate planning? Need a risk-managed portfolio management strategy to grow and protect your savings? Whatever your needs are, we are here to help.

Market Top Or Is It A Bubble?
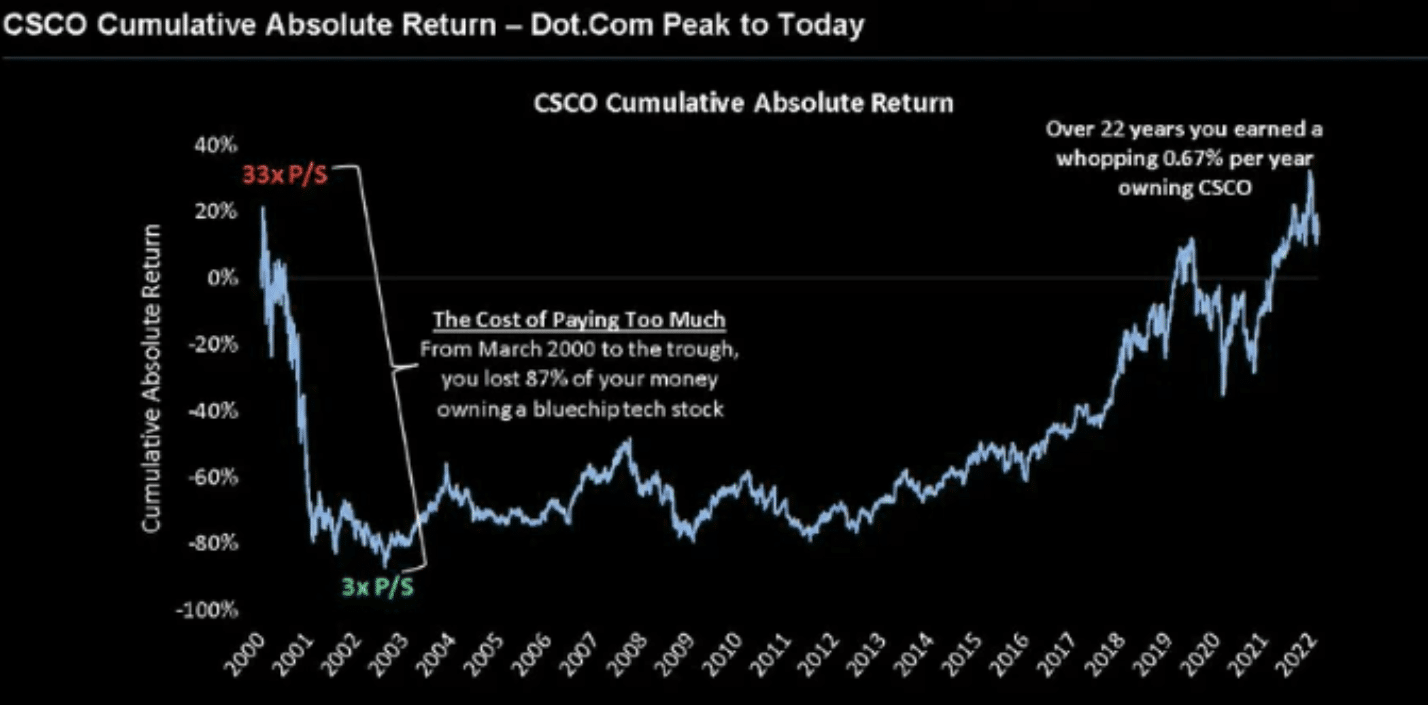
The run in Artificial Intelligence (A.I.) stocks this year has many analysts making comparisons to the 1999 “Dot.com” bubble. As shown in the chart below, there are some reasons for that concern. In 1999, Cisco Systems (CSCO) was the “belle of the ball,” and the “internet would change the world.” The thinking at that time was that the whole internet would run on Cisco routers at 50% gross margins. Today, Nvidia (NVDA) has 75% gross margins and 75% market share. Just as in 1999, extrapolated valuations rarely play out in reality.
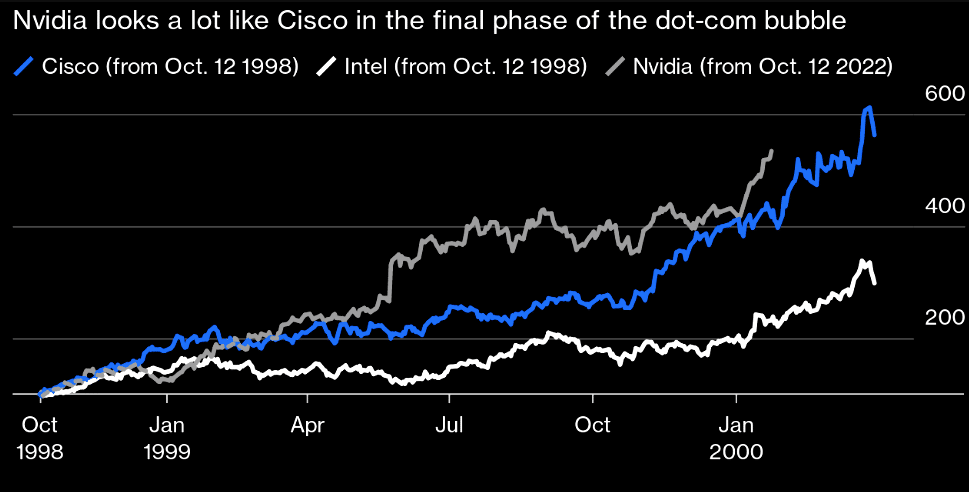
As discussed recently, the valuations investors currently pay for companies like Nvidia (35x Price-to-Sales) are also unsustainable. As shown in the chart from TheMarketEar below, when 33x sales were Cisco’s valuation at its peak of the “Dot.com” mania, investors lost 85% of their money when the stock price troughed in October 2002. Over the next 16 years, as investors waited to break even, the company grew revenues by 172% and earnings per share by a staggering 681%
Furthermore, there is certainly some concern given the valuations of the “Magnificient 7” versus the rest of the market.
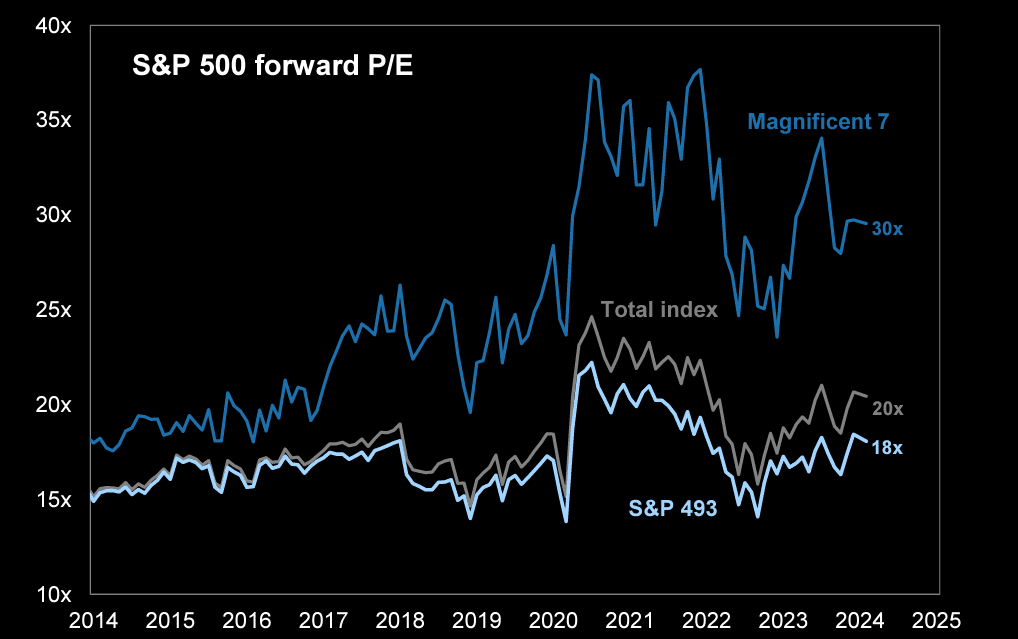
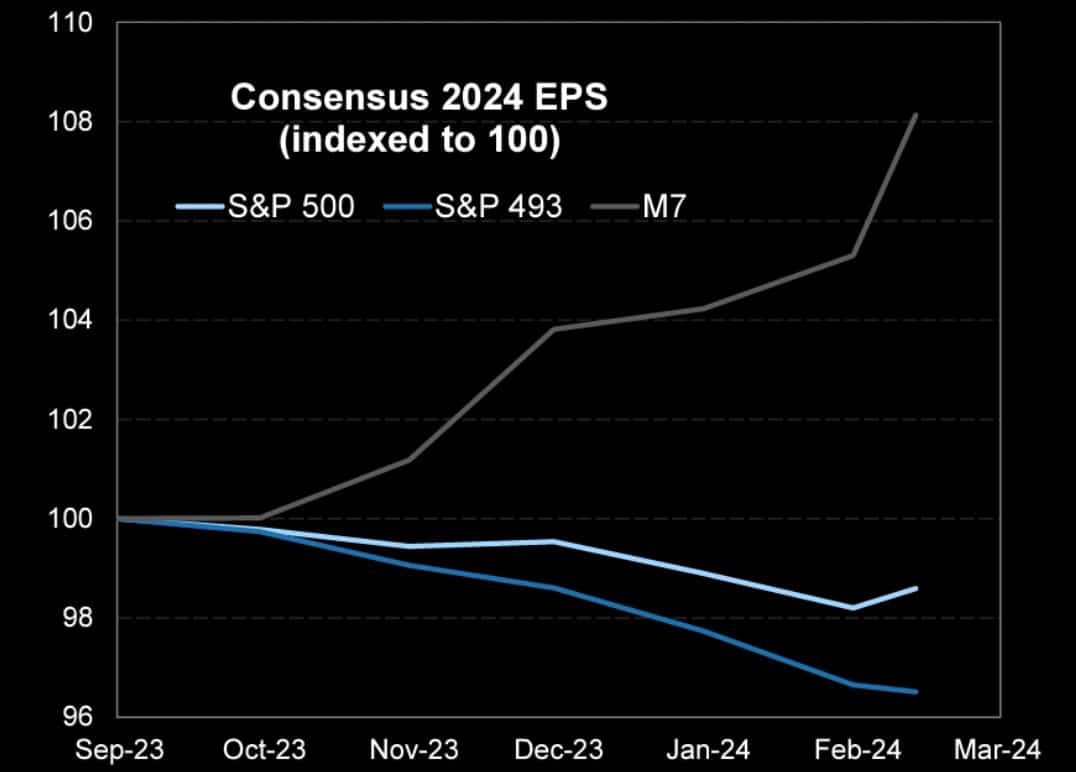
Notably, this is FORWARD valuations, which assumes that the “Magnificent 7” will obtain rather lofty earnings growth rates in the future versus relatively low expectations for the rest of the market. The problem is that Wall Street analysts, particularly at market extremes, are always wrong concerning their estimates.
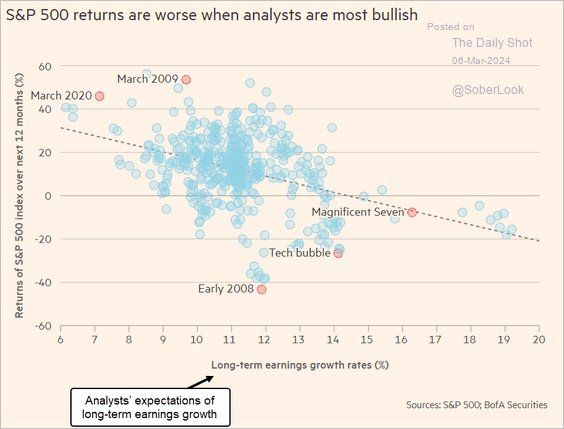
Therefore, the risk is that analysts expect continued strong earnings growth for the S&P 500, which is entirely based on the “Magnificant 7.” Of course, if the economy slows more than expected, those expected earnings are much too high.
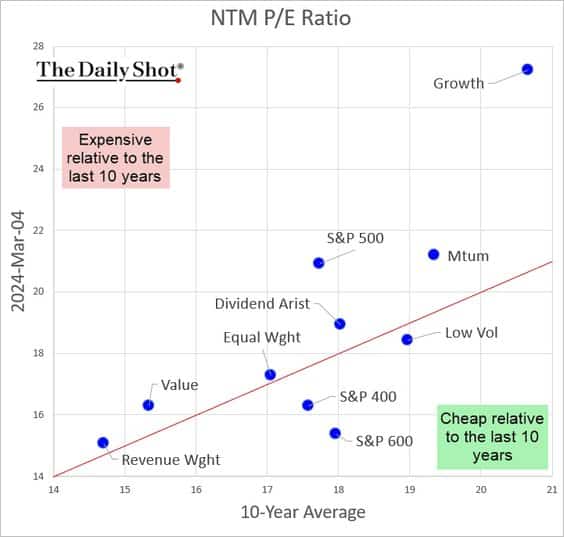
Notably, the valuations of the growth sector of the market are trading at astronomical levels relative to its 10-year average.
So, are we currently in a “bubble,” or is this just a potential short-term market top?
Probably Not A Bubble…Yet
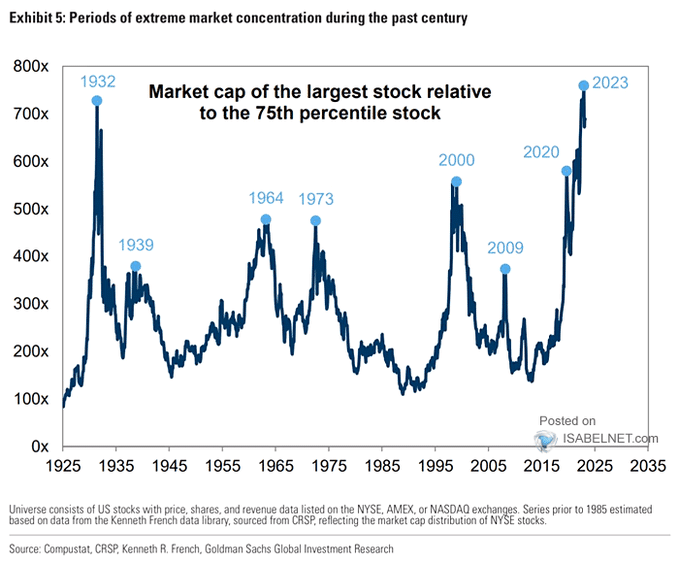
As noted, there are certainly concerns about the market. One of those concerns is the concentration of market capitalization within the index. Historically, such concentrations did not lead to the most bullish of outcomes.
However, there are several differences between today’s stock market rally and the “Dot.com” bubble. First, in 1999, many of the companies that were trading at astronomical heights had no earnings, little revenue, and, in many cases, were running up on “made up” metrics like “eyeballs” and “clicks” per page. Today, that story is quite different, with companies like Microsoft, Google, Amazon, Nvidia, AMD, and the rest generating billions in revenue, strong earnings growth, and fundamentally sound balance sheets.
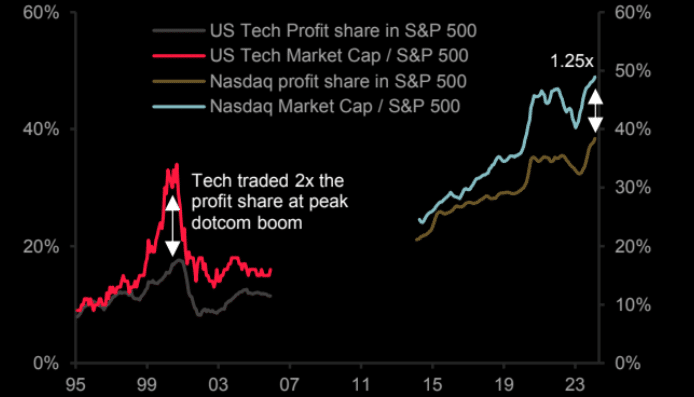
The chart below shows that technology stocks traded at 2x their profit share in 1999 versus just 1.25x currently. However, you have to be very careful with that statement. Valuations can adjust very rapidly, as they did in 1999. If the profit share falls, the valuation will go to 2x. Or, at current levels of profit share, a run to 6000ish will do the same.
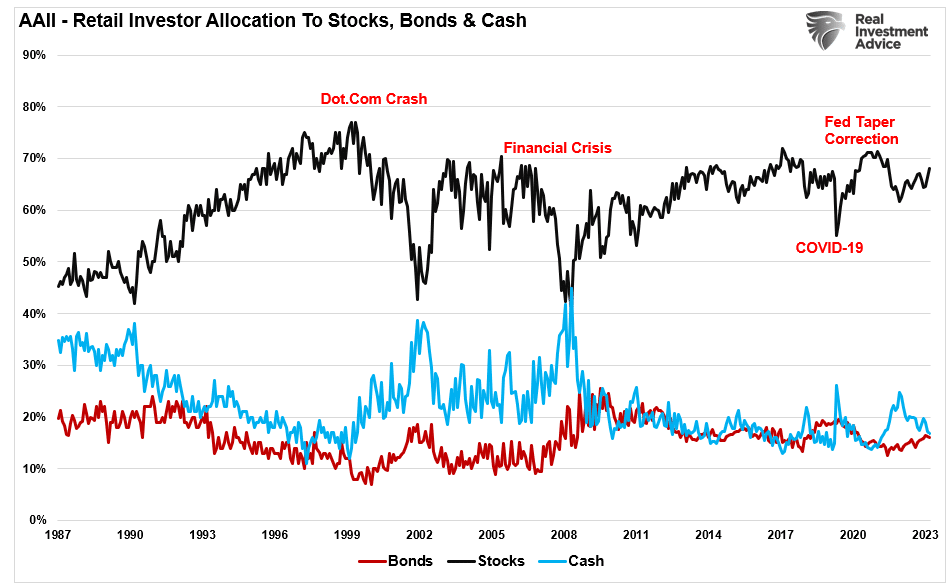
Furthermore, while sentiment is elevated, it is not in “bubble” territory just yet. In 2000, retail investor allocations were at 78% versus 68%. While the current level of equity allocations has been the highest since the financial crisis and the pre-COVID shutdown, it certainly doesn’t rule out a market top. However, equity allocations can certainly move higher to replicate the bubble frenzy of 2000.
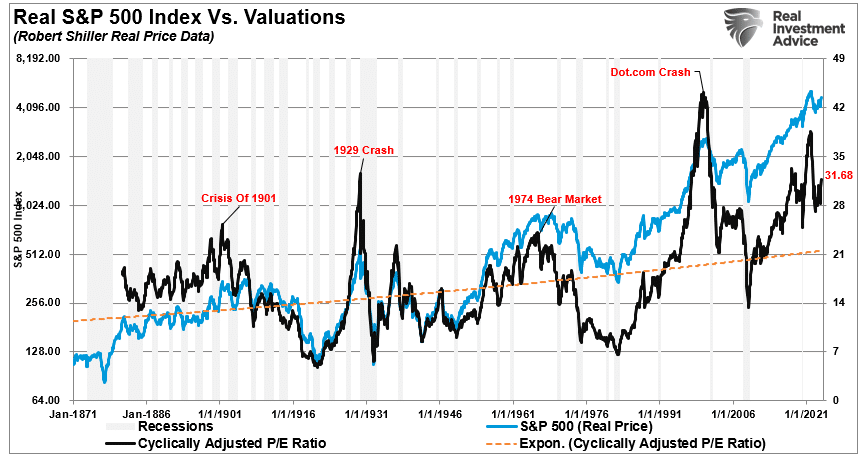
Of course, valuations are elevated based on the Shiller CAPE ratio but are not yet to previous bubble levels.
Does this mean there is absolutely no bubble in the markets currently? No. That is the tricky part. Unfortunately, bubbles are only evident in hindsight.
Probably A Market Top
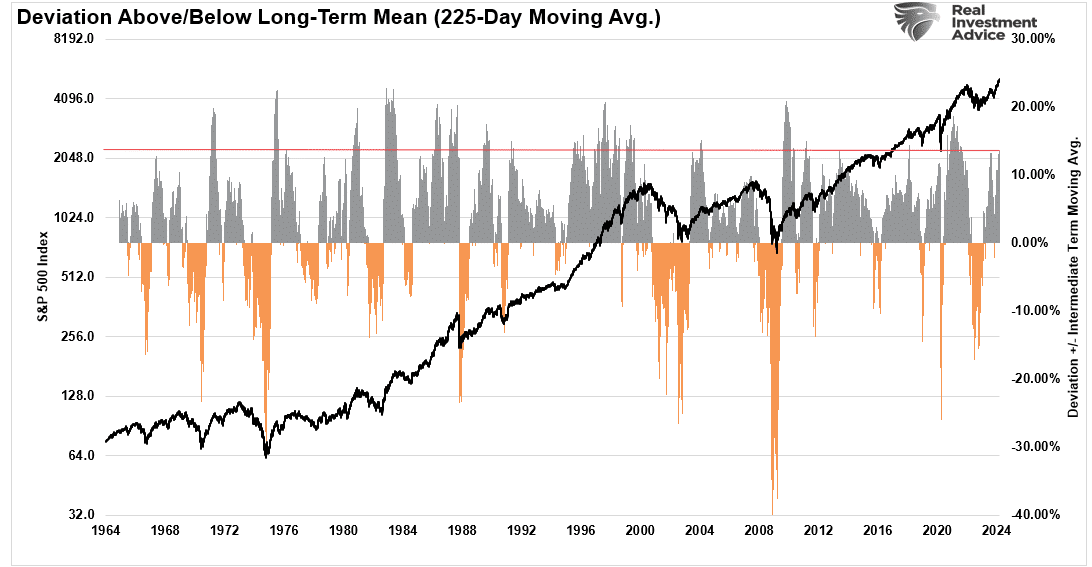
While we may not be in a full-fledged bubble yet, it doesn’t mean we aren’t on the way to that point. Investors are very exuberant, along with the media, and analysts are rapidly finding ways to justify excess valuations. In the near term, a market top is very likely. The market is currently up 17 of the past 19 weeks, the longest stretch since 1980. More importantly, the deviation of the market from the underlying 200-DMA is reaching rare extremes. Furthermore, as noted above, the market trades 3 standard deviations above the 50-DMA concurrently with market momentum and breadth deteriorating. Historically, such a combination was a decent warning of a near-term market top.
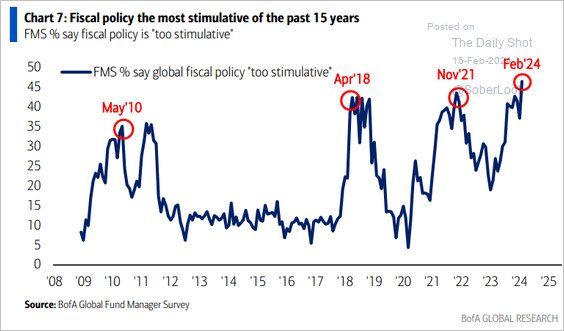
Critically, this rally has largely been a function of the most stimulative fiscal policy in the last 15 years. Notably, stimulative fiscal policy tends to reverse quickly from previous peaks. In other words, the supporting driver of the market rally since the October 2022 lows will likely end in 2024 for whatever reason. The reversal of that fiscal stimulus will coincide with a market top.
However, that doesn’t mean a market top will occur next week.
John Maynard Keynes once said, “Markets can remain irrational longer than you can remain solvent. “
Such is the problem with trying to “time” a market top, as they can last much longer than logic would predict. George Soros explained this well in his theory of reflexivity.
“Financial markets, far from accurately reflecting all the available knowledge, always provide a distorted view of reality. The degree of distortion may vary from time to time. Sometimes it’s quite insignificant, at other times it is quite pronounced. When there is a significant divergence between market prices and the underlying reality, the markets are far from equilibrium conditions.“
Every bubble has two components:
- An underlying trend that prevails in reality and;
- A misconception relating to that trend.
“When positive feedback develops between the trend and the misconception, a boom-bust process gets set into motion. The process is liable to be tested by negative feedback along the way, and if it is strong enough to survive these tests, both the trend and the misconception get reinforced. Eventually, market expectations become so far removed from reality that people get forced to recognize that a misconception is involved. A twilight period ensues during which doubts grow, and more people lose faith, but the prevailing trend gets sustained by inertia.” – George Soros
In simplistic terms, Soros says that once the bubble inflates, it will remain inflated until some unexpected, exogenous event causes a reversal in the underlying psychology. That reversal then reverses psychology from “exuberance” to “fear.”
What will cause that reversion in psychology? No one knows.
However, the important lesson is that market tops and bubbles are a function of “psychology.” The manifestation of that “psychology” manifests itself in asset prices and valuations.
Navigating Whatever This Is
‘I have no idea whether the stock market is actually forming a bubble that’s about to break. But I do know many bulls are fooling themselves thinking a bubble can’t happen when there is widespread concern. In fact, one of the distinguishing characteristics of a bubble is just that.” – Mark Hulbert
Whether you think the market is in a bubble or just forming a short-term top is mainly irrelevant. Every investor approaches investing differently.
However, if you’re nearing retirement or are a retiree, your investment horizon is shorter than that of much younger people. Therefore, given that you are less able to recover from the market’s deflation, it may be wise to consider the possibility.
So, what can you do to navigate the markets?
- Avoid the “herd mentality” of paying increasingly higher prices without sound reasoning.
- Do your research and avoid “confirmation bias.”
- Develop a sound long-term investment strategy that includes “risk management” protocols.
- Diversify your portfolio allocation model to include “safer assets.”
- Control your “greed” and resist the temptation to “get rich quick” in speculative investments.
- Resist getting caught up in “what could have been” or “anchoring” to a past value. Such leads to emotional mistakes.
- Realize that price inflation does not last forever. The larger the deviation from the mean, the greater the eventual reversion. Invest accordingly.
The increase in speculative risks and excess leverage leaves the market vulnerable to a sizable correction. Unfortunately, the only missing ingredient is the catalyst that brings “fear” into an overly complacent marketplace.
Currently, investors believe “this time IS different.”
“This time” is different only because the variables are different. The variables always are, but outcomes are always the same.
When the market corrects, the media will tell you, “No one could have seen it coming.”
Of course, hindsight isn’t very useful in protecting your capital.
How We Are Trading It
We remain in the camp that a 5-10% is coming over the next few months. Therefore, we remain cautious about deploying new capital and taking on excess risk in portfolios at current valuations.
With the earnings season behind us, the focus will return to the economic data and the Federal Reserve. As discussed previously, we have yet to see a meaningful rotation into value from growth, leaving this market confined to a tight trading range. We suspect that will change at some point, and our portfolio seems well positioned with some value balanced against growth for such a rotation.
Given we suspect a further correction is forthcoming, we suggest reverting to basic portfolio management rules to reduce portfolio risks for now.
- Trim Winning Positions back to their original portfolio weightings. (ie. Take profits)
- Sell Those Positions That Aren’t Working. If they don’t rally with the market during a bounce, they will decline when it sells off again.
- Move Trailing Stop Losses Up to new levels.
- Review Your Portfolio Allocation Relative To Your Risk Tolerance. If you have an aggressive allocation to equities, consider raising cash levels and increasing fixed income accordingly to reduce relative market exposure.
The market remains quite bullish, but that is also when the risk of a reversal is the greatest.
Have a great week.
Research Report

Subscribe To “Before The Bell” For Daily Trading Updates
We have set up a separate channel JUST for our short daily market updates. Please subscribe to THIS CHANNEL to receive daily notifications before the market opens.
Click Here And Then Click The SUBSCRIBE Button
Subscribe To Our YouTube Channel To Get Notified Of All Our Videos
Bull Bear Report Market Statistics & Screens

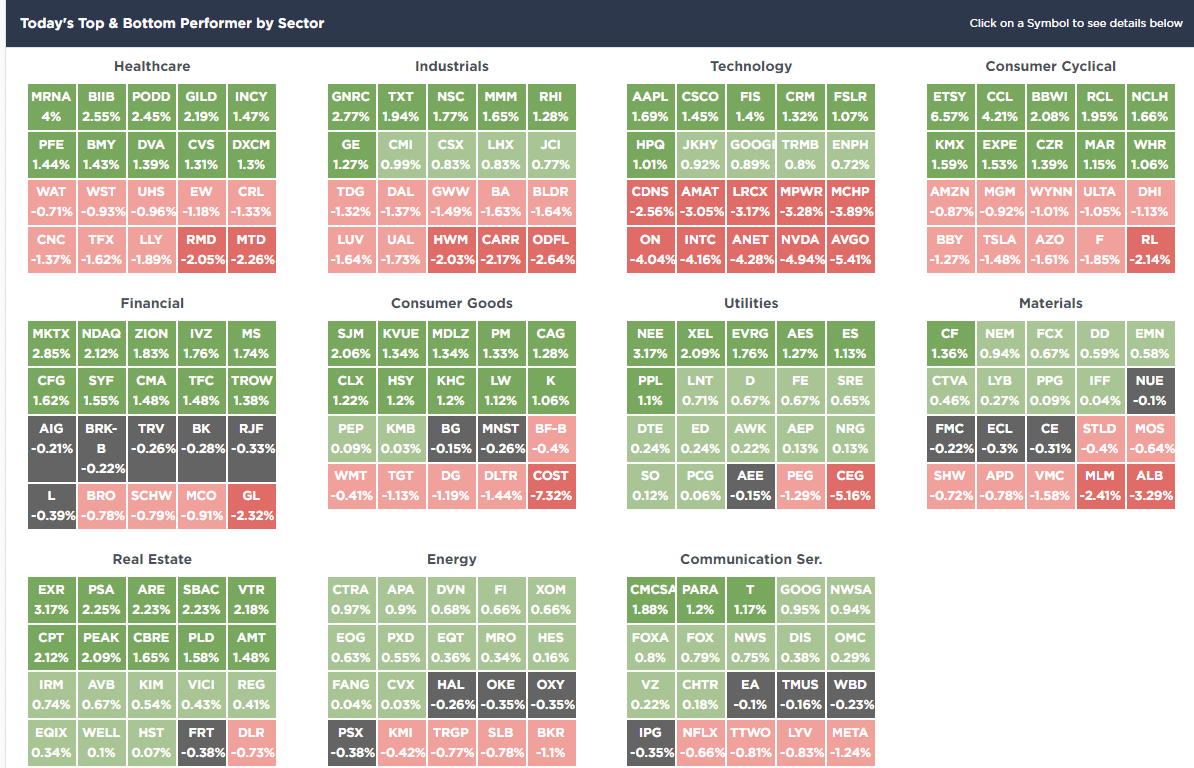
SimpleVisor Top & Bottom Performers By Sector
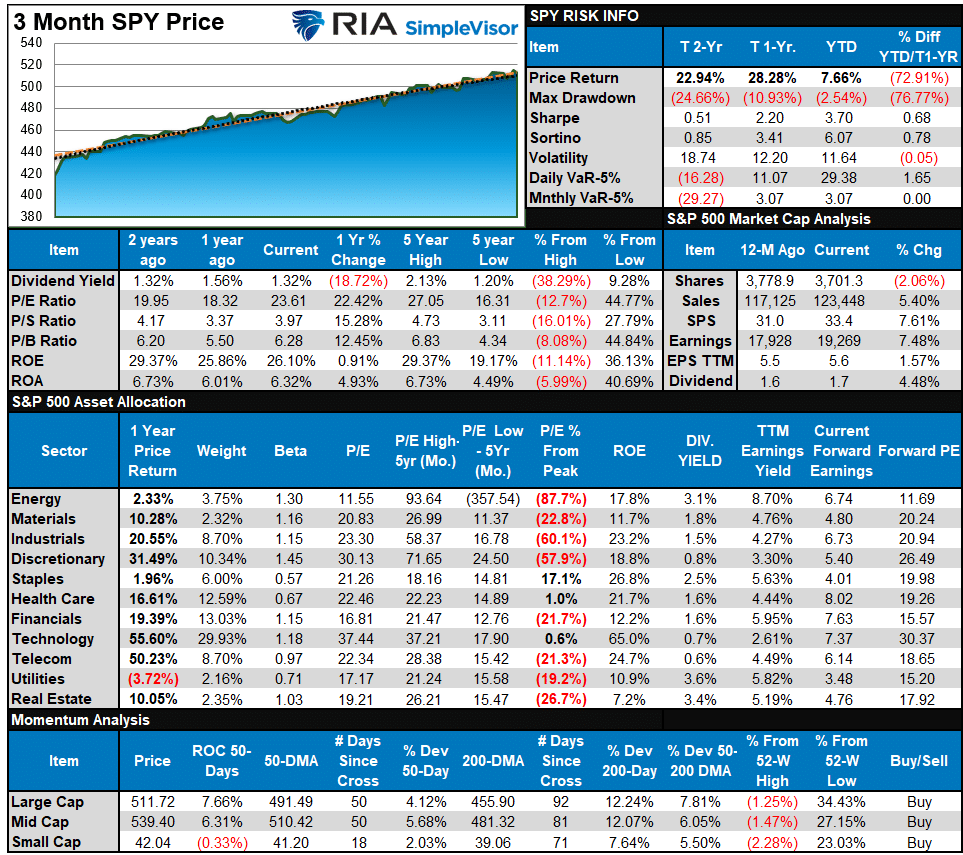
S&P 500 Weekly Tear Sheet
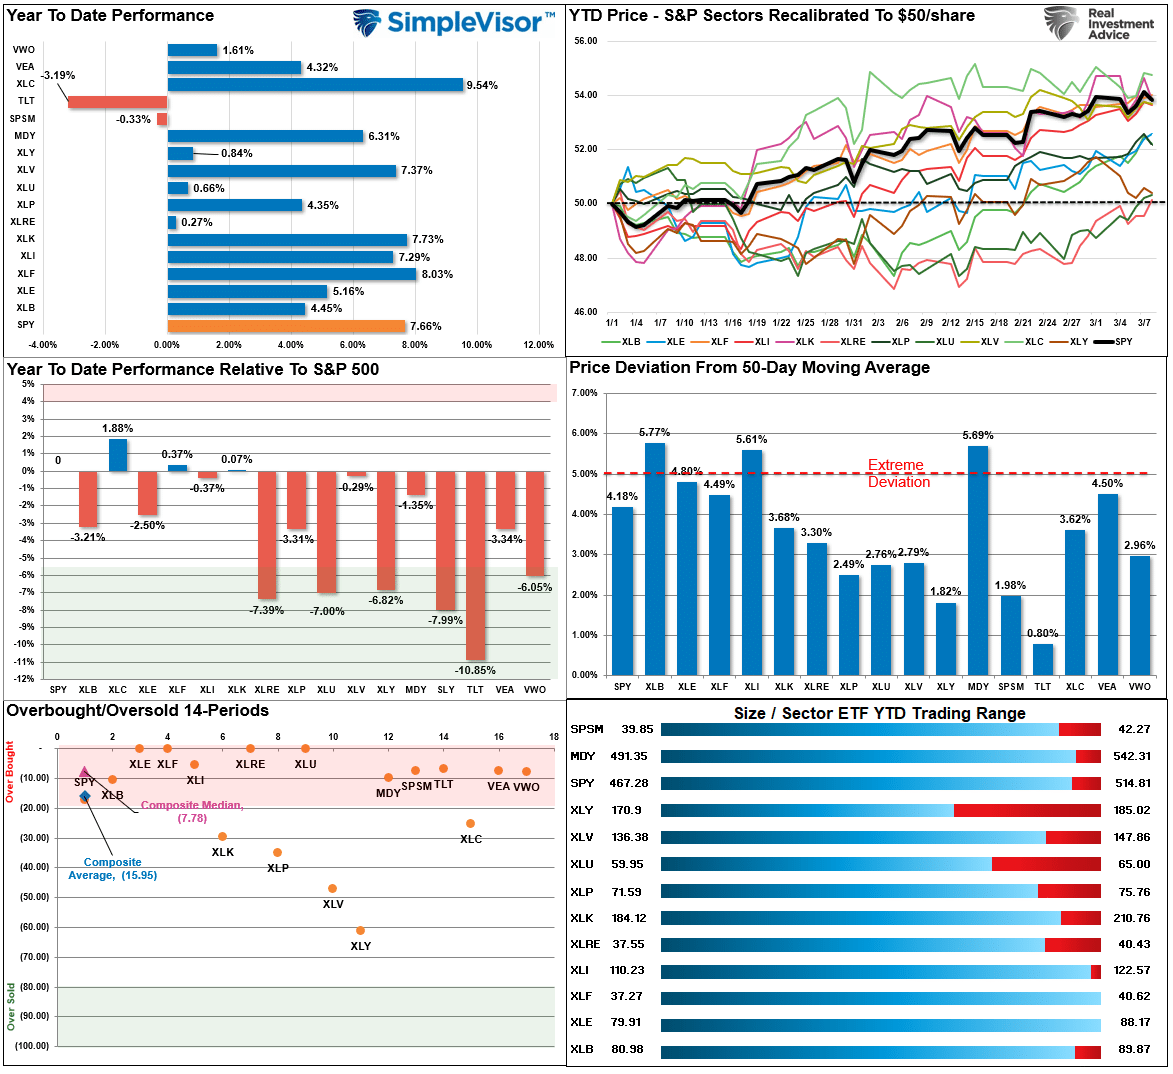
Relative Performance Analysis
The bull trend in stocks remained uninterrupted this past week, with the S&P 500 hitting all-time highs after weakness early in the week. However, the push higher put most sectors and markets back to extreme short-term overbought conditions, which will likely limit further upside over the next week as the market continues trading in a tight range since the November lows. The bullish backdrop remains very strong, and there is little reason for an abundance of caution. However, profit-taking and risk management remain prudent, with most markets and sectors overbought and deviating from their 50-DMA.
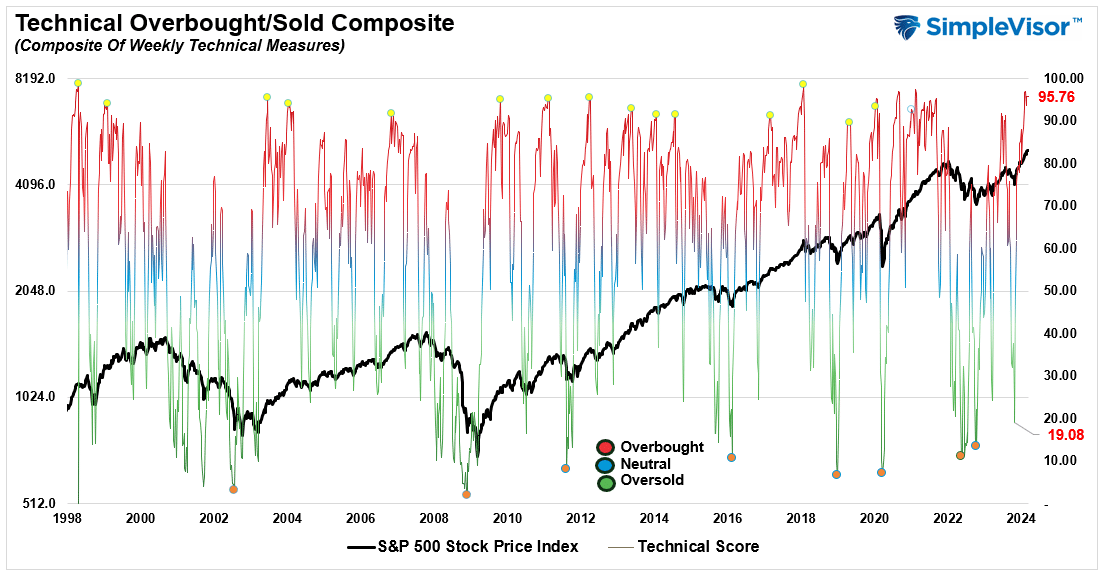
Technical Composite
The technical overbought/sold gauge comprises several price indicators (R.S.I., Williams %R, etc.), measured using “weekly” closing price data. Readings above “80” are considered overbought, and below “20” are oversold. The market peaks when those readings are 80 or above, suggesting prudent profit-taking and risk management. The best buying opportunities exist when those readings are 20 or below.
The current reading is 95.76 out of a possible 100.
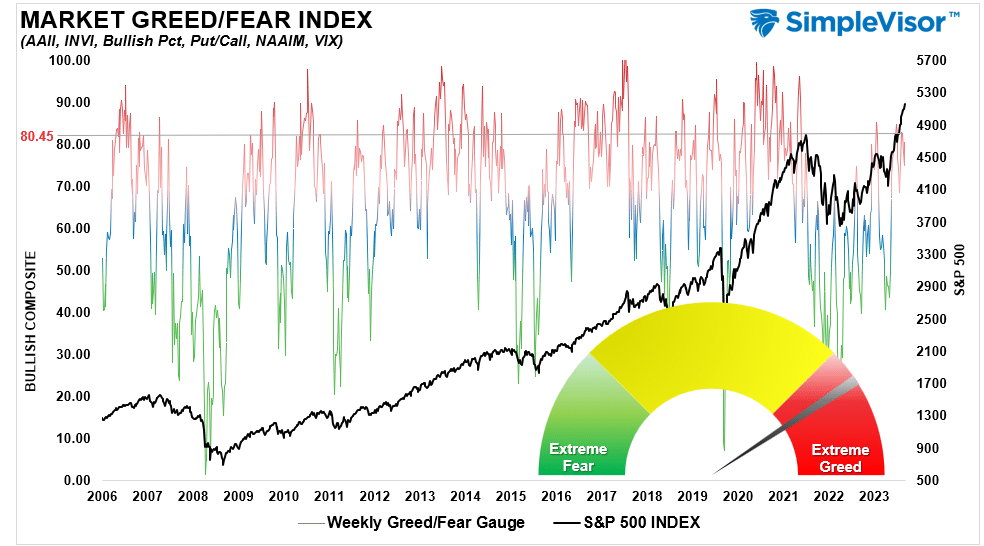
Portfolio Positioning “Fear / Greed” Gauge
The “Fear/Greed” gauge is how individual and professional investors are “positioning” themselves in the market based on their equity exposure. From a contrarian position, the higher the allocation to equities, the more likely the market is closer to a correction than not. The gauge uses weekly closing data.
NOTE: The Fear/Greed Index measures risk from 0 to 100. It is a rarity that it reaches levels above 90. The current reading is 80.45 out of a possible 100.
Relative Sector Analysis
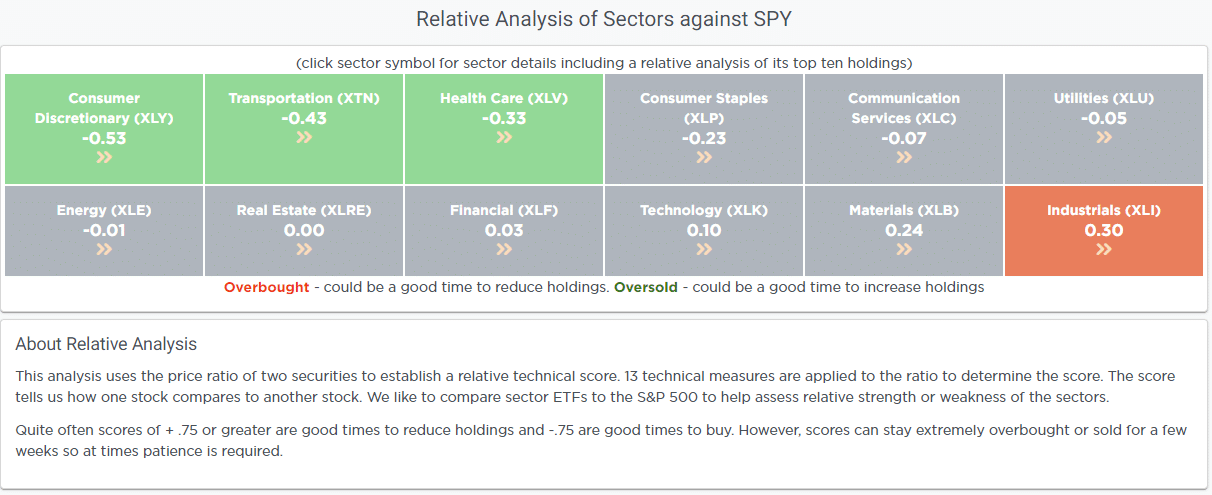
Most Oversold Sector Analysis
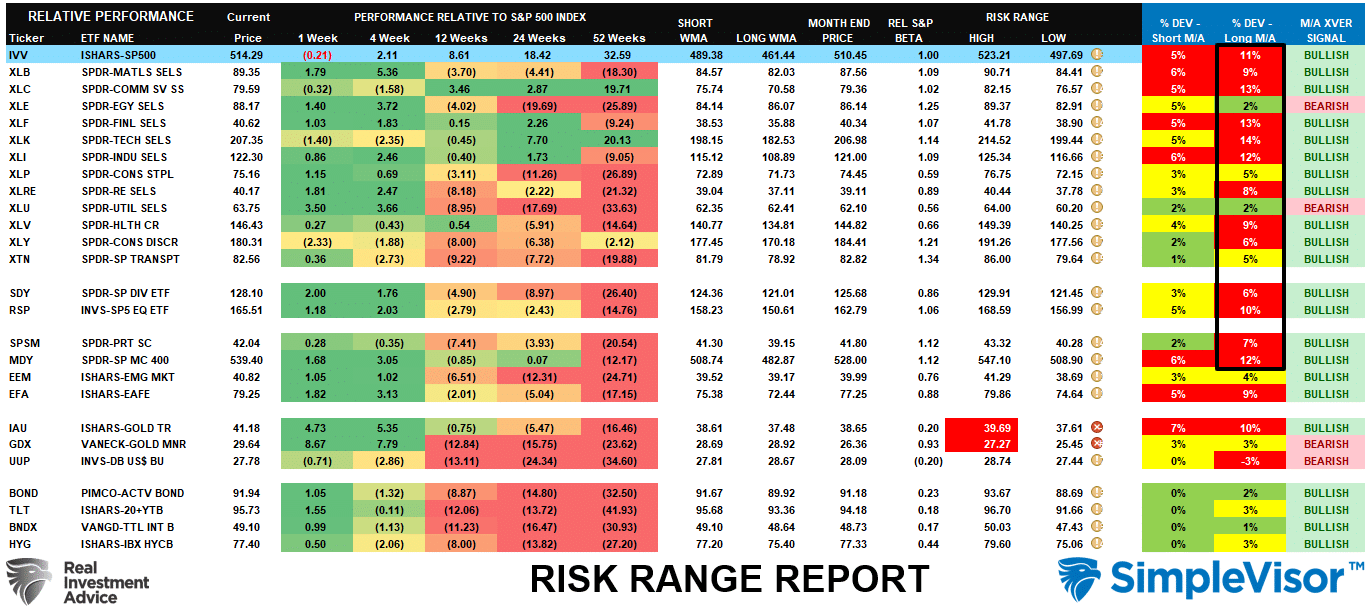
Sector Model Analysis & Risk Ranges
How To Read This Table
- The table compares the relative performance of each sector and market to the S&P 500 index.
- “MA XVER” (Moving Average Crossover) is determined by the short-term weekly moving average crossing positively or negatively with the long-term weekly moving average.
- The risk range is a function of the month-end closing price and the “beta” of the sector or market. (Ranges reset on the 1st of each month)
- The table shows the price deviation above and below the weekly moving averages.
Deviations for many market sectors from their longer-term moving averages are extreme. Gold and Gold Miners are well outside their normal risk ranges as well, suggesting profit-taking should be implemented. The bullish backdrop of the market overall remains but is very “long in the tooth.” A correction is coming. It is only a function of time. Don’t get caught “sleeping at the wheel.”
Weekly SimpleVisor Stock Screens
We provide three stock screens each week from SimpleVisor.
This week, we are searching for the Top 20:
- Relative Strength Stocks
- Momentum Stocks
- Fundamental & Technical Strength W/ Dividends
(Click Images To Enlarge)
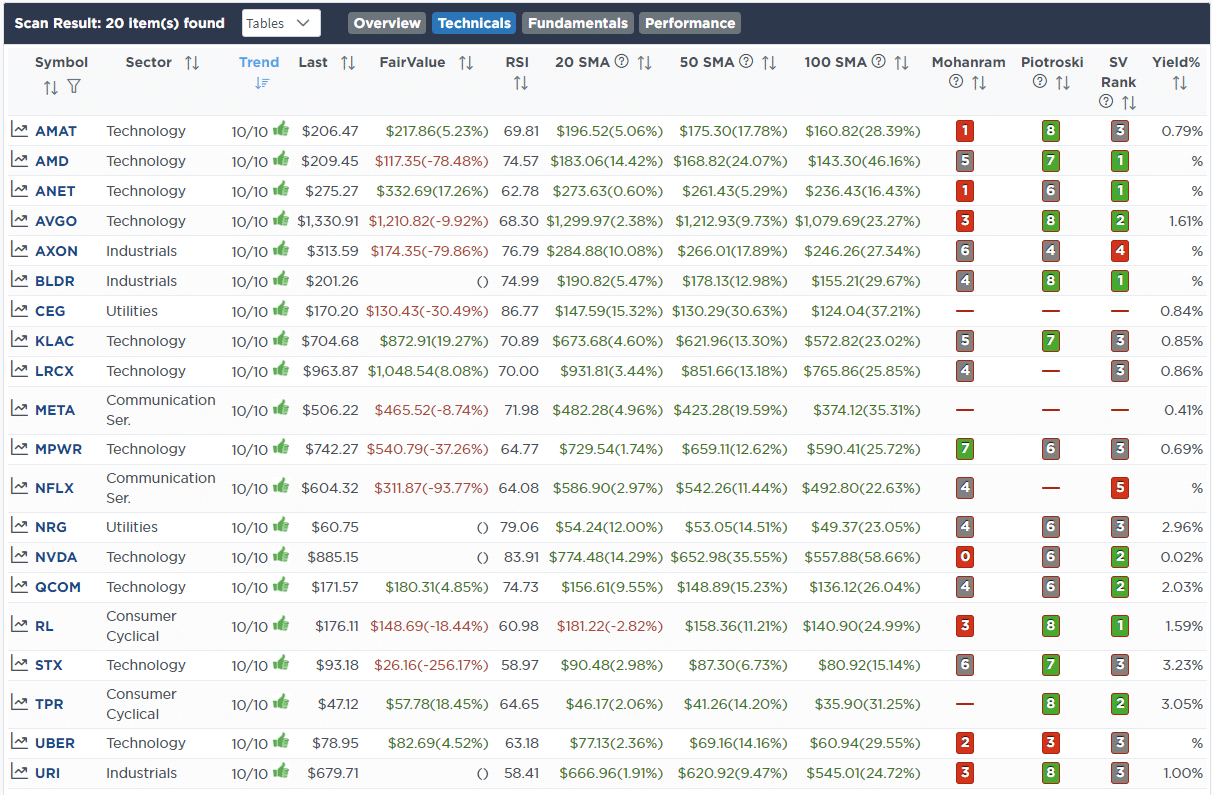
R.S.I. Screen
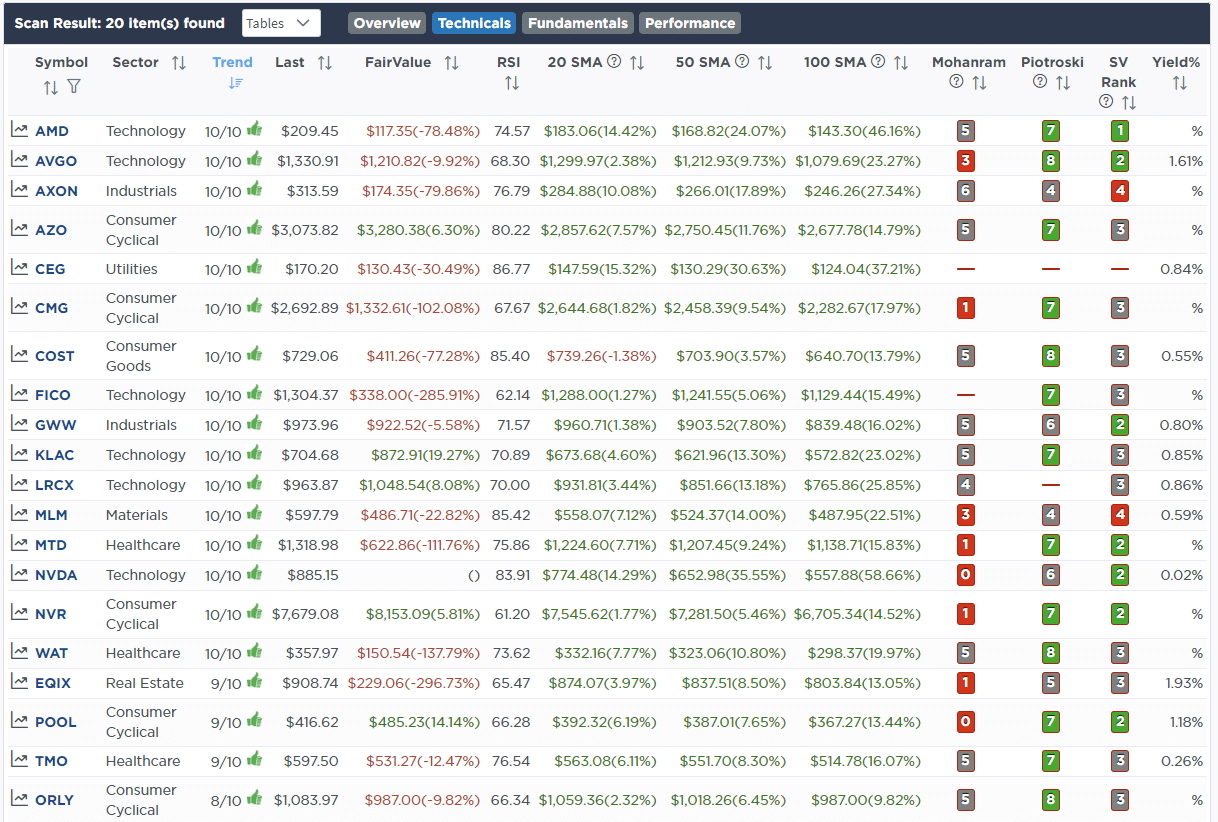
Momentum Screen
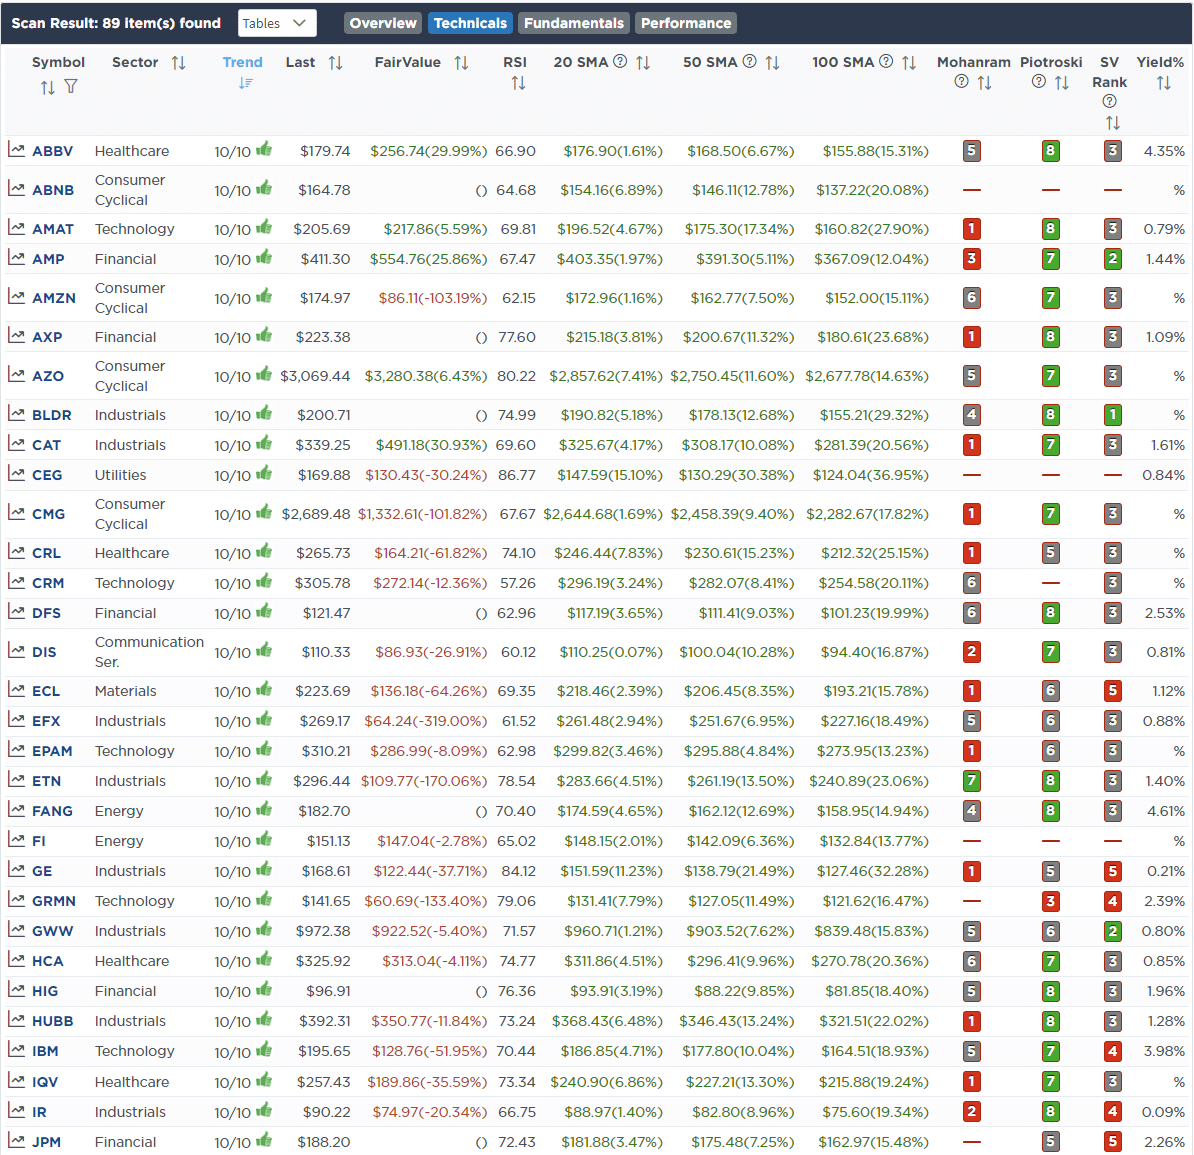
Fundamental & Technical Strength
SimpleVisor Portfolio Changes
We post all of our portfolio changes as they occur at SimpleVisor:
No Trades This Week

Lance Roberts, C.I.O.
Have a great week!