Even in a choppy market, the charts speak volumes. Whether you’re watching metals like Gold, major pairs like EUR/USD, or crypto like Bitcoin, clean price action and technical clarity can still guide your trades.
Here’s a sharp breakdown of today’s four hot assets — with key levels, directional bias, and actionable setups.
Gold remained in consolidation mode, trading above a rising trendline.
- If price clears $3,380, bulls could quickly push it toward $3,395.
- Holding above $3,395 would confirm trend continuation.
- Strong support at $3,345, followed by $3,334.
- A break below $3,334 may lead to a deeper correction — trendline break = caution.

- Dip-buyers could consider $3,345 / $3,334 for entries.
- Place stop-losses under the trendline.
- Add on a confirmed breakout above $3,380.
- Current: $3,365
- Resistance: $3,380 / $3,395
- Support: $3,345 / $3,334
Gold is still coiling. The structure favors bulls — but breakouts matter more than bias.
The US Dollar Index (DXY) is following a bearish structure, trading inside a descending wedge. A sharp sell-off on weak ADP data hit the index after it tested the upper wedge boundary.
Thursday’s bounce looked corrective at best.

- Trend remains bearish unless DXY breaks out of the wedge.
- Support lies at 98.55, the 0.0 Fib and psychological floor.
- RSI is hovering around 42, suggesting weak momentum.
- Minor geopolitical factors (like tariff pauses) may offer intraday support — but the broader pressure remains.
Unless there’s a breakout, this wedge favors further downside in the short term.
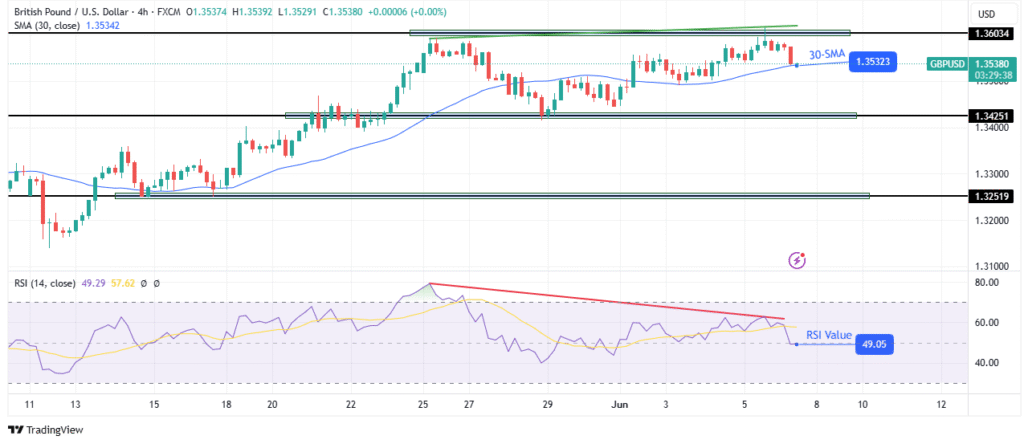
EUR/USD is holding within an ascending channel, bouncing off higher lows and facing resistance at 1.1435.

Break above 1.1435 opens the door to 1.1456, then 1.1500.
- Immediate support at 1.1371.
- If broken, watch 1.1341, then 1.1315 (strong demand zone).
- Buy-the-dip near 1.1371 or 1.1341 with stops under 1.1315.
- Add fresh longs on a clean break above 1.1435.
- Resistance: 1.1435 / 1.1456 / 1.1500
- Support: 1.1371 / 1.1341 / 1.1315
The structure supports bulls — but breakout confirmation is key to trend continuation.
Bitcoin traded inside an ascending channel and recently attempted a falling wedge breakout.

A breakout above $105,154 could rally toward:
- $106,828 (upper wedge target)
- $107,504 (channel resistance)
Rejection at $105K may lead to a drop toward:
Possibly as low as $103,000–$102,800
- Breakout traders: Entry above $105,154, with targets at $106,828 / $107,504.
- Dip buyers: Look near $104,000 / $103,800, with tight stops.
- Sellers: Watch for rejection candles near resistance.
- Resistance: 105,154 / 106,828 / 107,504
- Support: 104,000 / 103,818 / 103,000
Bitcoin is coiling up — any move above $105K could trigger momentum. But failure here may invite another test of support.
Technical setups are like roadmaps. They don’t guarantee the destination — but they help you avoid getting lost.
If you’re navigating these markets, make sure you’re working with the right structure, levels, and strategy. And if you’re not sure where to start…