GBP/JPY Marks a Major Top – Will It Revert to 200.00?

GBP/JPY is a historically popular pair in Forex trading, as it is one of the most volatile products to trade and captures geographic dynamics and risk-on/risk-off flows.

The pair once again stands at a key inflection point, right after a historic run back to 2008 levels, and can offer quite interesting setups amid elevated market volatility.

It can be affected by recent tariff developments, as GBP has a historical correlation with Equity markets. Hence, if Markets rally after the tariff cancellation, GBP/JPY can retest recent highs.

However, bearish Stock Markets could bring the pair back to 200.00, a 9,000-pip move from current levels, if geopolitical developments sour sentiment.

After an insane run on the Yen throughout the latter part of 2025, the landmark victory in Japanese snap elections brought some confidence in the currency and calmed the spikes in long-end yields.

On the other hand, Sterling could be facing some weakness ahead. The UK reported the highest unemployment rate since 2021, and with a relatively cooling Inflation Rate (still too elevated for the Bank of England), the Central Bank might be inclined to cut.

With Rate differentials converging and sentiment souring, GBP/JPY could be facing a significant reversal in the coming times. The challenge for FX traders will be to capture the trade optimally.

Let’s dive into a multi-timeframe analysis and technical levels for GBP/JPY, which could soon be subject to intense volatility.

GBP/JPY Multi-timeframe Technical Analysis

Daily Chart

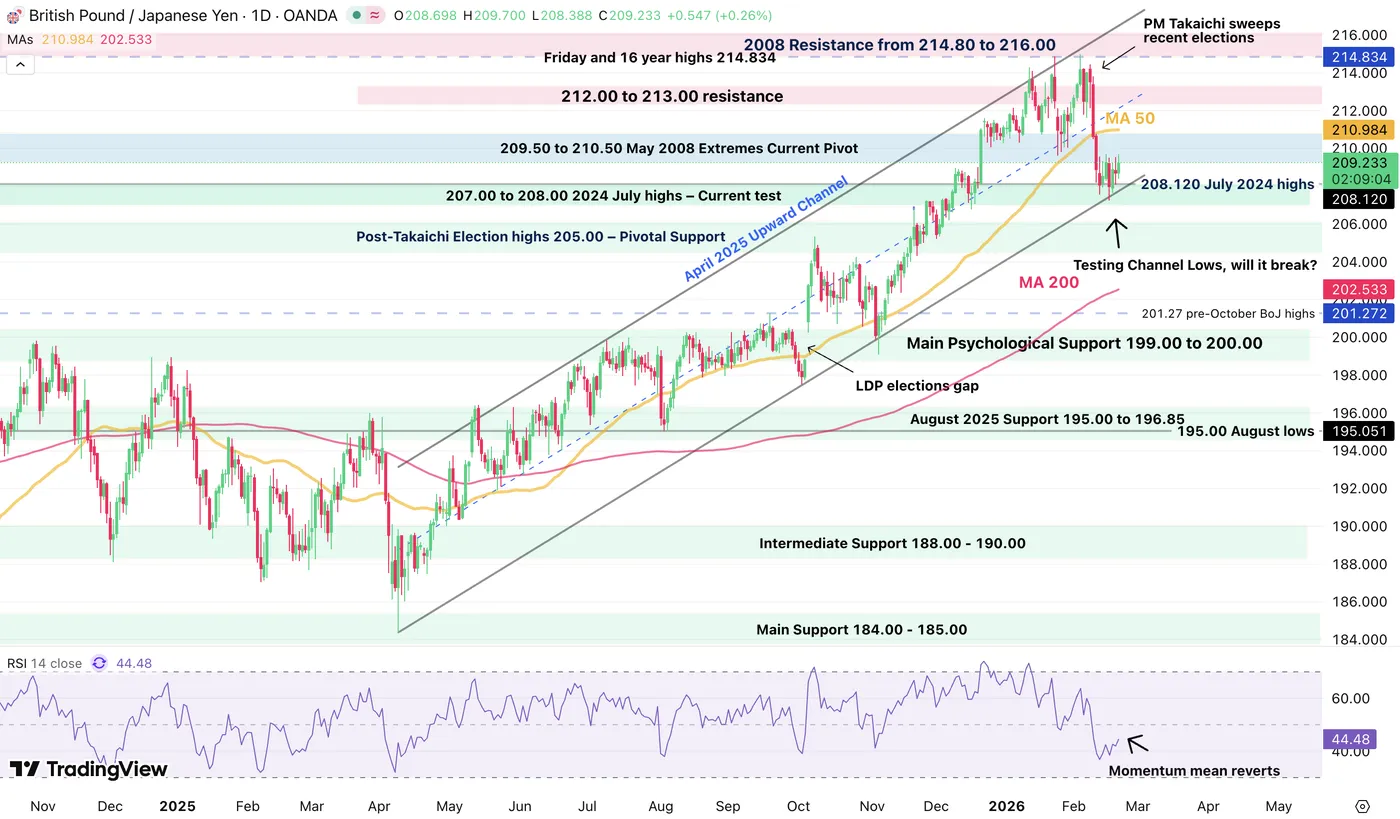
GBP/JPY Daily Chart, February 20, 2026 – Source: TradingView

The pair is consolidating at the lows of its Mid-2025 channel that took the pair back to 2008 highs.

Momentum cool downs are common after such gigantic moves, but with recent Market developments, the action could soon get spicy.

As GBP/JPY tests its Pivot Zone, let’s take a look closer at what could tilt the scales.

4H Chart and Technical Levels

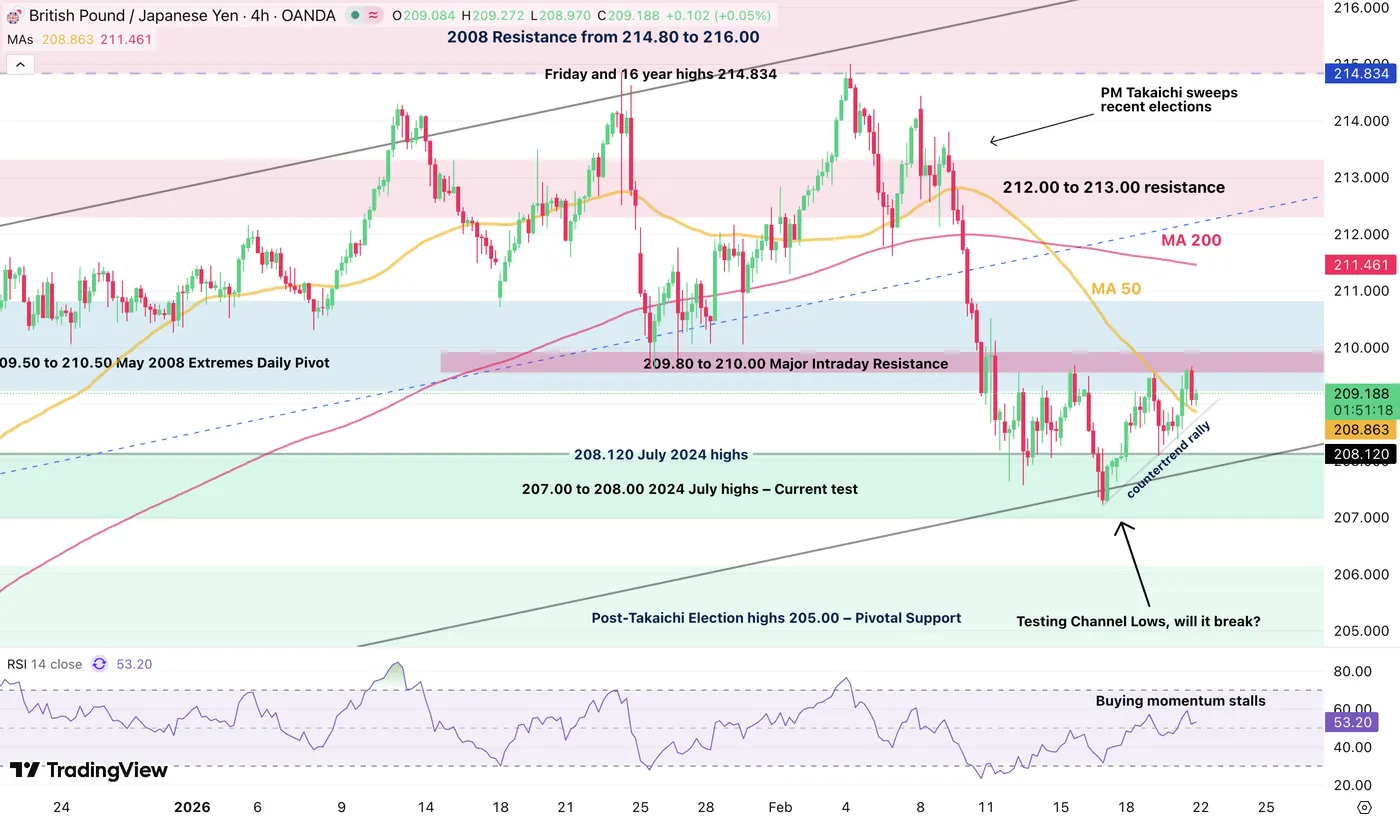
GBP/JPY 4H Chart, February 20, 2026 – Source: TradingView

The action recently formed a major intraday resistance (209.50 to 210.00) right at the beginning of its Pivot zone, leaving two potential scenarios:

  • With recent rejection of resistance, sellers are attempting to take the upper hand
    • Look for a break of the intraday upward trendline.
    • Closing below the trendline should see a swift test of February lows at 207.240.
    • Breaking this could see acceleration towards the 205.00 Pivotal Support.
      • Watch out as these targets are quite far and closer profit-taking could maximize the chance to secure trading profits.
  • Any break and session close above 210.00 will give more chances to test the 50-Day MA and top of the Daily Pivot Zone (210.90 to 211.00) – Lower probabilities in the current course of action

Levels to watch for GBP/JPY trading:

Support Levels:

  • 208.80 Countertrend micro-support (if break, bears take the hand)
  • 208.120 July 2024 highs mini-support
  • 207.50 to 208.00 2024 July highs – recent test
  • Post-Takaichi Election highs 205.00 – Pivotal Support (breaking this opens the door to 200.00
    Main Key Support 199.00 to 200.00

Resistance Levels:

  • 209.50 to 210.00 Major Intraday Resistance
  • 210.90 50-Day MA
  • 212.00 to 213.00 resistance
  • Early February 16 year highs 214.834

1H Chart

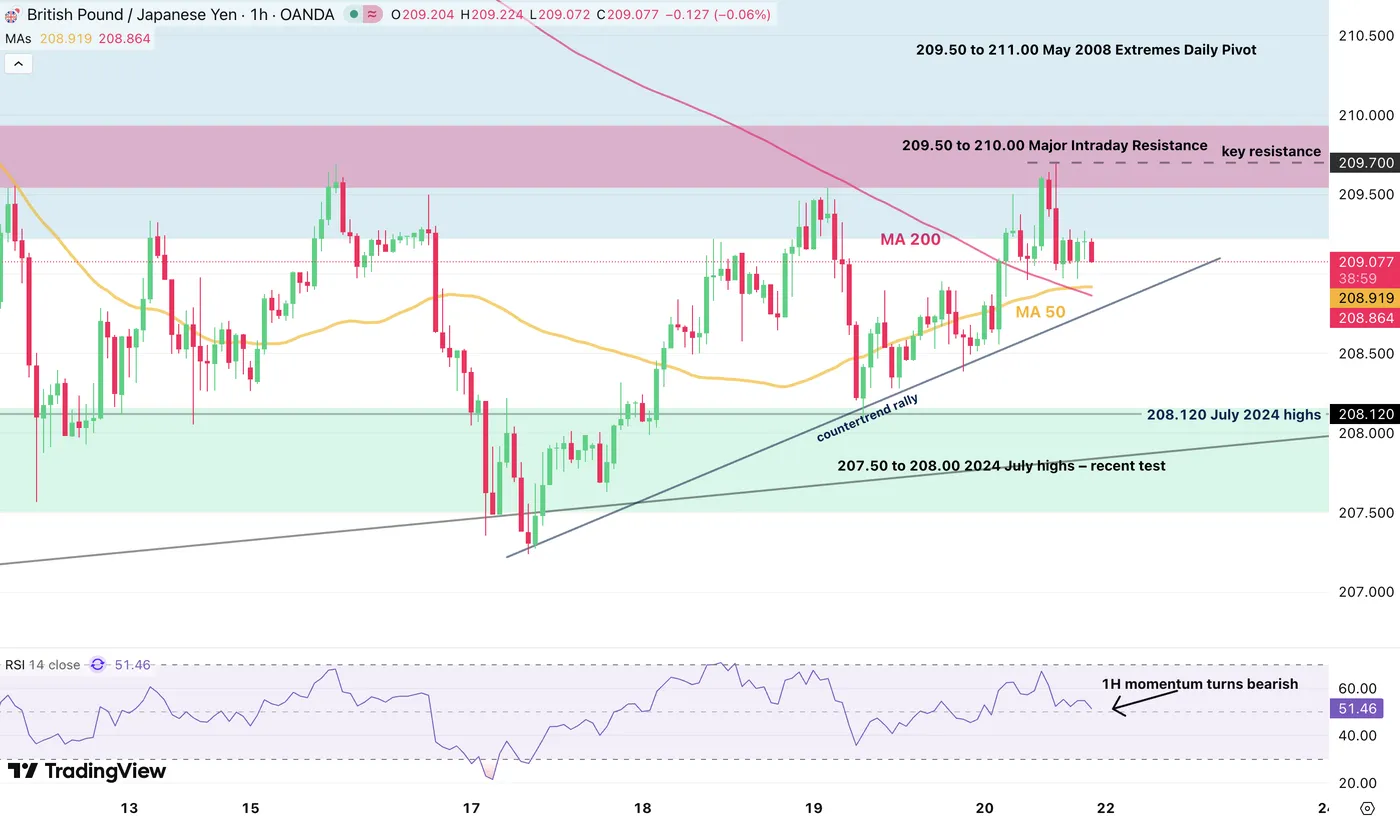
GBP/JPY 1H Chart, February 20, 2026 – Source: TradingView

With recent rejection of the intraday resistance, a bearish move could appear.

  • Watch out for weekend volatility which could lead to spikes at the Sunday Globex open (hence requiring larger stops, make sure to respect your risk-tolerance in that aspect).

To confirm the reversal, traders will want to see a break of the trendline.

  • On the other hand, bouncing higher from here and closing above the Intraday resistance would point to higher odds of testing the 50-Day MA.

Safe Trades!

Source link

Visited 1 times, 1 visit(s) today

Related Article

USD/JPY Daily Outlook - ActionForex

USD/JPY Daily Outlook – ActionForex

Daily Pivots: (S1) 154.58; (P) 154.96; (R1) 155.38; More… USD/JPY’s rally from 152.25 continues today and intraday bias stays on the upside for 157.65 resistance first. Break there will target a retest on 159.44 high. On the downside, below 154.33 minor support will turn intraday bias neutral and bring consolidations. Overall, with 38.2% retracement of

USD/JPY Weekly Outlook - ActionForex

USD/JPY Weekly Outlook – ActionForex

USD/JPY’s strong rebound last week suggests that fall from 157.65 has completed at 152.25. Initial bias is turned neutral this week firs. On the upside, above 155.63 will resume the rally from 152.25 and target 157.65 first. Overall, with 38.2% retracement of 139.87 to 159.44 at 151.96 intact, rise from 139.87 is expected to resume

EUR/USD Weekly Outlook - ActionForex

EUR/USD Weekly Outlook – ActionForex

EUR/USD’s fall from 1.2081 extended lower last week but recovered after hitting 1.1740. Initial bias is turned neutral this week first. But risk will stay on the downside as long as 1.1928 resistance holds. Below 1.1740 will target 1.1576 support next. Firm break there should confirm rejection by 1.2 key psychological level and turn near

Forex market volatility analysis showing PMI reports and US GDP data impact on currency trading

PMI Reports and US GDP Data Trigger Critical Market Movements

BitcoinWorldForex Volatility Surge: PMI Reports and US GDP Data Trigger Critical Market Movements Global currency markets brace for significant volatility this week as Purchasing Managers’ Index (PMI) reports from major economies and crucial US Gross Domestic Product (GDP) data converge to create potentially market-moving conditions. Forex traders worldwide monitor these economic indicators closely, anticipating substantial

EUR/GBP Daily Outlook - ActionForex

EUR/GBP Daily Outlook – ActionForex

Daily Pivots: (S1) 0.8729; (P) 0.8740; (R1) 0.8756; More… Intraday bias in EUR/GBP remains neutral with focus on 0.8744 resistance. Decisive break there should confirm that fall from 0.8863 has completed as a correction. Further rally should then be seen back to retest 0.8863 high. On the downside, sustained break of 38.2% retracement of 0.8221

EUR/JPY Daily Outlook - ActionForex

EUR/JPY Daily Outlook – ActionForex

Daily Pivots: (S1) 181.94; (P) 182.54; (R1) 183.08; More… Intraday bias in EUR/JPY remains mildly on the upside for the moment. Corrective fall from 186.86 could have completed after drawing support from 38.2% retracement of 172.24 to 186.86 at 181.27. Further rise should be seen to retest 186.22/186.86 resistance zone first. One the downside, however,

The Market is Seeking a Haven

The Market is Seeking a Haven

JPY and EUR are giving back their safe-haven status to USD. USDJPY is rising amid slowing Japan inflation. Growing geopolitical tensions in the Middle East and the Fed’s reluctance to resume its cycle of monetary expansion are driving the US dollar towards its best weekly performance in four months. According to a Wall Street Journal

USD/CAD Forecast Today 20/02: Trades in a Range (Chart)

Trades in a Range (Chart)

Created on February 20, 2026 The US dollar has been all over the place against the Canadian dollar during trading on Thursday. The price action right now is focusing on the 1.37 level, an area that I think will cause a little bit of a headache, but it’s also worth noting that markets have seen

Breaking News

Love Island and Towie stars plead guilty over illegal Instagram finance scheme

For free real time breaking news alerts sent straight to your inbox sign up to our breaking news emails Sign up to our free breaking news emails Sign up to our free breaking news emails Seven reality stars and influencers have pleaded guilty to the illegal promotion of foreign exchange trading on Instagram. Lauren Goodger,

image1.png

The 8 best forex brokers in the USA

To be recognized as one of the best forex brokers in the USA, a brokerage needs to give you a large number of currency pairs, low spreads, minimal costs, and the best trading platforms with analysis tools. Strong customer service and education resources are essential, too. This list of top brokers for U.S.-based traders can

Silver (XAG/USD) Rallies Back Above $80, More Incoming? – Technical Outlook

Silver (XAG/USD) Rallies Back Above $80, More Incoming? – Technical Outlook

Metals are slowly recovering after their high-paced deleveraging from late January trading. Establishing consolidative ranges and holding tight right around their 2026 opening levels, the Precious Commodities are facing key technical tests in their historic runs. Indeed, after their shocking up-and-down performances in the first two months of the year, it is even more astonishing

US Supreme Court Strikes Down Trump Tariffs

US Supreme Court Strikes Down Trump Tariffs

The U.S. Supreme Court has officially struck down the Trump administration’s global tariffs, ruling that the executive branch exceeded its authority under the IEEPA. For now, the action remains very muted across FX, Stocks, and Crypto Markets, which are all close to unchanged on the session. Only Metals are rallying, but that would mainly reflect

Canada retail sales slip -0.4% mom in December, January rebound expected

Canada retail sales slip -0.4% mom in December, January rebound expected

Canada’s retail sales declined -0.4% mom in December to CAD 70.0B, slightly better than the -0.5% drop expected. The pullback marks a modest softening in year-end consumer activity, though the headline miss was not as severe as feared. Core retail sales, which exclude gasoline and motor vehicles, fell -0.3% mom, weighed heavily by a sharp

Silver Price Breaks February Resistance Line

Silver Price Breaks February Resistance Line

As seen on the XAG/USD chart, silver has today breached the upper boundary of the descending channel formed by February’s lower highs and lows. Bullish sentiment is supported by heightened geopolitical tensions and rising demand for safe-haven assets. According to media reports: → On Thursday, US President Donald Trump warned Iran that it must reach

BTC/USD Analysis: Are the Bulls Stirring?

BTC/USD Analysis: Are the Bulls Stirring?

According to media reports, Bitcoin’s fall from its all-time high in October 2025 to February’s low near $60k triggered the largest outflow from spot Bitcoin ETF funds since their launch in January 2024. Glassnode data show that more than 100,000 BTC were withdrawn from these funds in January alone, though the total remains substantial, with

UK retail sales surge 1.8% in January, strongest since May 2024

UK retail sales surge 1.8% in January, strongest since May 2024

UK retail sales volumes jumped 1.8% mom in January, far exceeding expectations of 0.2% and marking the largest monthly increase since May 2024. The rebound suggests consumers began the year on firmer footing despite broader concerns over slowing growth. On an annual basis, sales volumes rose 4.5% yoy, pointing to solid underlying demand. Over the

USD/CHF Carves a Bottom after Reaching 14-Year Lows

USD/CHF Carves a Bottom after Reaching 14-Year Lows

2025 was the year of the Swiss Franc, and there were quite a few reasons. De-dollarization, flows moving towards Europe, the Yen losing some of its Safe-Haven characteristics amid fiscal trouble in Japan, and general diversification towards quality as the World faces troubled times ahead. Reaching 14-year lows less than a month ago, USD/CHF had

NZ trade deficit at NZD -519m as China flows diverge

NZ trade deficit at NZD -519m as China flows diverge

New Zealand’s goods exports rose 2.6% yoy in January to NZD 6.2B, up NZD 157m from a year earlier. Goods imports increased 1.9% yoy to NZD 6.7B, up NZD 126m. The result was a monthly trade deficit of NZD -519m. By destination, export performance was mixed. Shipments to China, New Zealand’s largest trading partner, fell

image

GBP/USD Forex Signal 19/02:British Pound Likely to Make Move

Created on February 19, 2026 The British pound has fallen on Wednesday, as we continue to see pressures on this currency. GBPUSD The British pound has fallen again during the trading session on Wednesday against the US dollar as we are now testing the 50-day EMA and the 1.35 level. With that being said, I

dna-markets.png

The best prop firms for US traders in 2026

We’ve tested over 40 challenges and funded accounts to shortlist the 5 top prop trading firms for USA traders. We assessed the process from start to finish, assessing each firm’s challenges, rules, financial instruments, fees, payouts and scaling plans, giving you a solid understanding of the options available in the United States before you start

0
Would love your thoughts, please comment.x
()
x