Global markets closed February under conditions few anticipated even days ago. The events in the last 48 hours have shifted the framework from negotiation risk to open conflict. A geopolitical “black swan” has moved from theoretical scenario to live reality.
What had been treated for months as a tail risk scenario has now materialized into direct military confrontation. Markets are no longer pricing probabilities; they are reacting to reality.
The collapse of the Geneva negotiations on February 26–27 marked the final diplomatic failure. By February 28, the long-running shadow war transitioned into open kinetic engagement. The shift from proxy skirmishes to direct aerial bombardment of Iranian territory represents a structural escalation, not a tactical flare-up.
The reported targeting of leadership compounds in Tehran signals something more consequential than a punitive strike. It suggests a strategic pivot away from containment. The objective appears not merely to deter, but to reshape.
Reports that Supreme Leader Ali Khamenei was killed in an Israeli airstrike—if confirmed—would represent the most significant political rupture in Iran since 1979. For 36 years, Khamenei functioned as the final arbiter of Iranian military and nuclear doctrine. His removal introduces a power vacuum at the highest level of the regime.
That vacuum is not administrative; it is existential. Authority now fragments across the Guardian Council, the Islamic Revolutionary Guard Corps, and competing clerical factions. The uncertainty over who controls strategic assets—including nuclear decision-making—has elevated geopolitical risk to unprecedented levels.
This is the primary driver behind the immediate “panic bid” in traditional safe havens. Markets are not responding to a headline; they are repricing systemic uncertainty. The absence of a clear successor or stabilization mechanism removes the typical “off-ramp” that traders rely upon in geopolitical crises.
Institutional positioning suggests that some participants had anticipated escalation. Late Friday saw evidence of quiet risk reduction. When US President Donald Trump signaled that the diplomatic window was effectively closed, institutional desks treated the rhetoric as a near-certainty of kinetic action, particularly with carrier strike groups already deployed.
What distinguishes this episode from prior Middle Eastern tensions is the shift in scale and intent. This is not limited retaliation; it is leadership targeting. That distinction changes the risk matrix from cyclical volatility to structural regime uncertainty.
Energy markets are immediately implicated. Any instability in Iran’s command structure raises questions over the Strait of Hormuz, regional oil flows, and the behavior of proxy forces such as Hezbollah and the Houthis. The implications extend beyond crude prices to European energy security.
Europe, in particular, faces second-order risks. The region remains sensitive to supply disruptions following the prior energy shock. Currency markets have already begun to treat this as a European security issue, not merely a Middle Eastern conflict.
Financial markets now enter a new phase where geopolitical premium becomes embedded rather than episodic. This environment challenges traditional cross-asset relationships. Inflation expectations, safe-haven flows, and energy risk may all move simultaneously—but not necessarily in predictable directions.
The technical structures across equities, bonds, currencies, and commodities will now determine whether this shock becomes a temporary dislocation or the start of a broader trend reversal. Key support and resistance levels across major benchmarks will serve as early stress tests.
Volatility at the start of the week will likely reveal whether institutional capital views this as a contained military episode or the beginning of a protracted confrontation.
In the sections that follow, we examine how this geopolitical rupture is interacting with technical inflection points in DOW, US 10-year yields, Dollar Index, Swiss Franc, Gold, and WTI crude. The macro shock has arrived. Now the charts will determine its staying power.
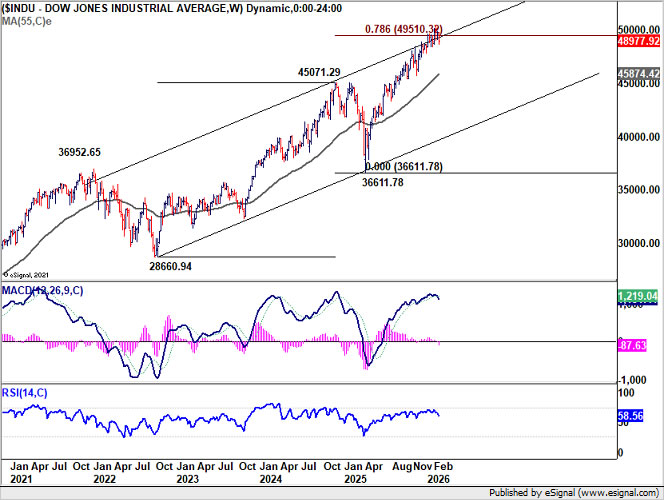
DOW Faces First Real Stress Test at 48,459
DOW now sits at a critical technical juncture as markets reopen under full geopolitical stress. Immediate focus is on 48,459.88 support. Decisive break below that level would strongly suggest that the uptrend from 36,611.78 (2025 low) has completed a five-wave sequence at 50,512.79. If that interpretation holds, the current decline would represent more than a routine pullback; it would mark the start of a broader corrective phase.
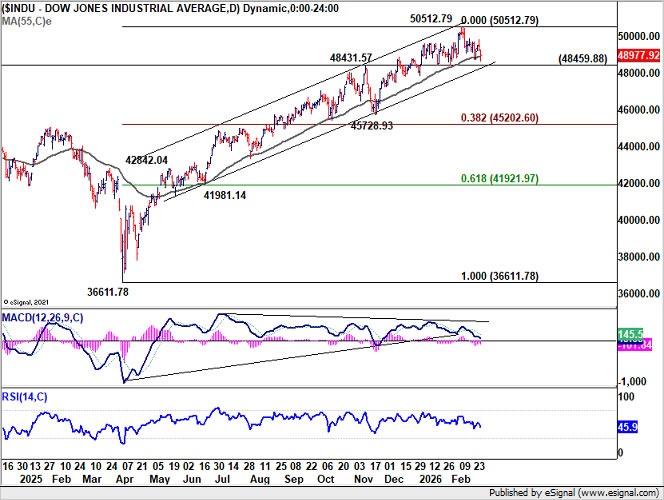
In such a scenario, the next key downside target lies near 45,728.93. Importantly, that area aligns with a dense cluster of structural support, including the 55 W EMA (now at 45,874) and 38.2% retracement of 36,611.78 to 50,512.79 at 45,202.60. Such confluence zones should attract defensive positioning on first test, making this band a likely battleground between dip buyers and macro de-risking flows.
However, the true line in the sand sits at the 45,000 psychological level. Decisive weekly break below 45k would signal that the market has shifted from corrective weakness to medium-term bearish reversal.
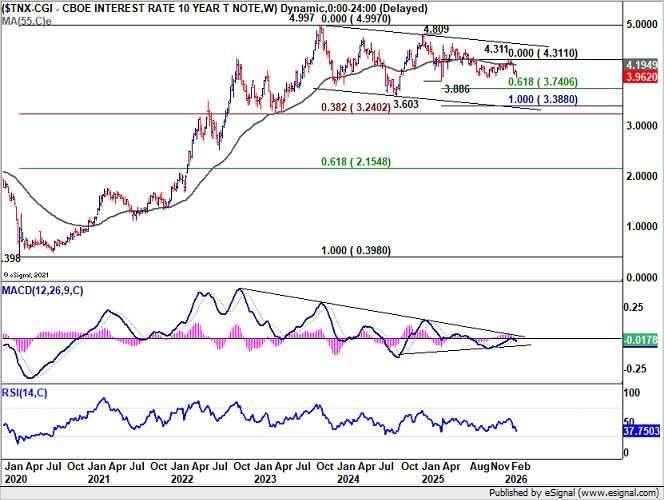
10-Year Yield Breaks 4% as Panic Bid Overwhelms War Inflation
The US 10-year Treasury yield delivered one of the clearest signals of the shock’s intensity, gapping lower on Friday and closing at 3.962 after decisively breaking below the 4.0% psychological mark. In a typical war scenario, investors might price higher inflation risk through elevated energy costs and supply disruptions. Instead, the immediate reaction has been a forceful rush into principal safety, overwhelming any inflation premium.
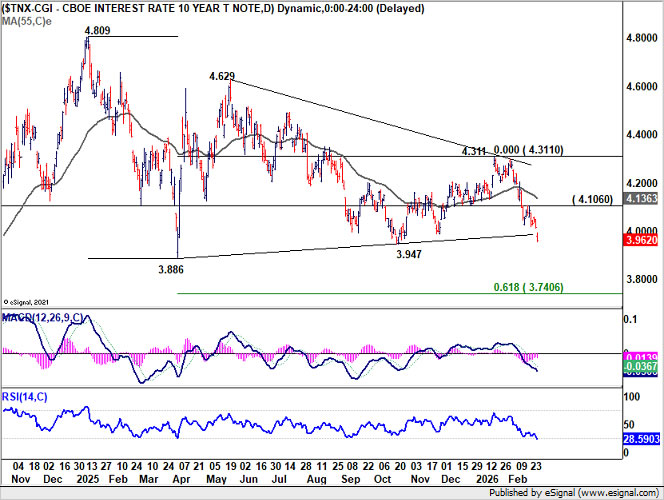
Momentum now suggests a break of 3.947 medium-term support is likely. The next critical level is 3.886 (2025 low). A firm move below that would confirm that the rejection from the 55 W EMA (now at 4.194) was not temporary, but structural. In that case, yields could extend toward the 61.8% projection of 4.809 to 3.886 from 4.311 at 3.740, with even deeper downside potential toward 100% projection at 3.388 if safe-haven flows intensify.
However, markets remain at a fork in the road. Should yields instead reclaim 4.106 resistance, it could signal that the “sell America” narrative is back.
Dollar Index at Structural Crossroads Amid Conflicting Forces
Dollar Index now finds itself at a critical inflection point, caught between opposing macro currents. On one hand, geopolitical escalation and equity weakness typically generate safe-haven demand for the greenback. On the other, the sharp decline in US yields compresses rate differentials, undermining one of the Dollar’s primary pillars of support. The result is hesitation rather than conviction.
In the short term, attention centers on the 55 D EMA (now at 97.91). A firm push above that level would reinforce rebound momentum. Yet the broader technical structure remains vulnerable unless 100.39 resistance is decisively reclaimed. That level serves as the threshold separating corrective bounce from genuine trend reversal.
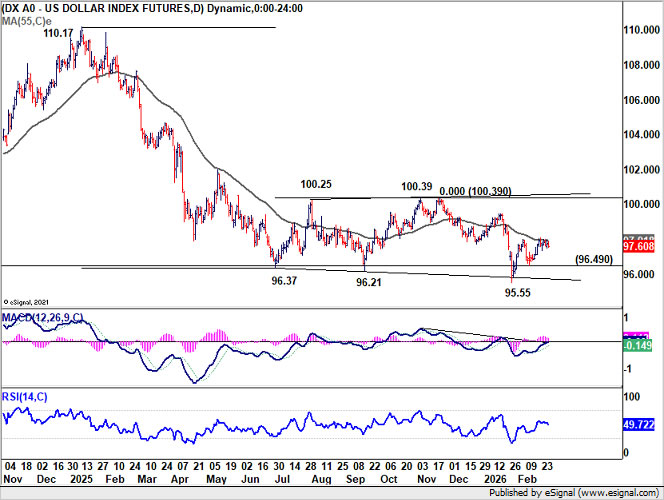
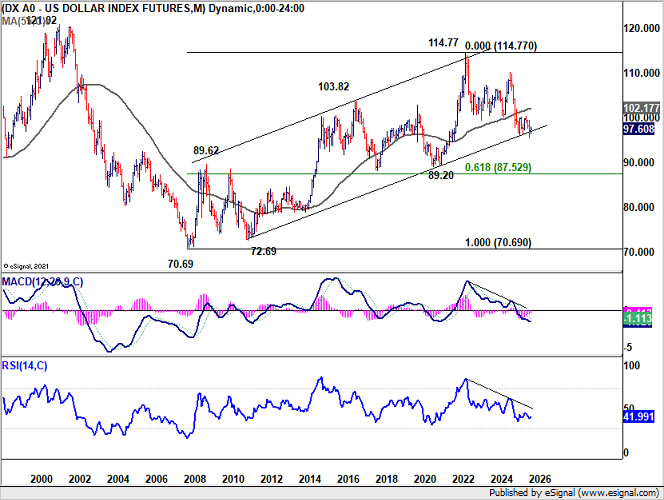
More structurally, the Index is pressing against the lower boundary of the long-term channel that has defined the uptrend since the 2008 low at 70.69. This is a make-or-break moment. A strong bounce from here, followed by a break of 100.39, would argue the multi-decade uptrend remains intact. Conversely, a clean fall below 95.55 would confirm a broader multi-year downtrend, potentially accelerating Dollar weakness at precisely the moment global uncertainty is rising.
Swiss Franc Confirms Full Risk Escalation as EUR/CHF Breaks Down
The Swiss Franc has emerged as the clearest barometer of geopolitical stress. Its surge to multi-year highs against the Euro confirms that markets view this conflict not merely as a Middle Eastern event, but as a broader European security risk. Energy supply vulnerability and proximity to the geopolitical fault line have amplified defensive flows into CHF.
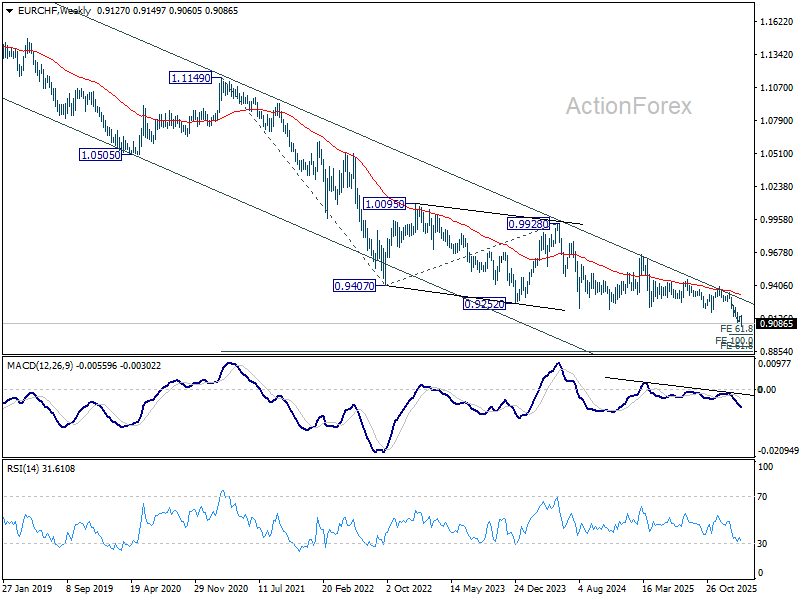
EUR/CHF has already broken decisively to the downside, resuming its medium-term down trend. As long as 0.9149 resistance holds, the bearish outlook remains intact. The next immediate target stands at the 61.8% projection of 0.9347 to 0.9092 from 0.9149 at 0.8991. A firm break below that would not merely be technical follow-through—it would reflect deepening risk aversion across European assets.
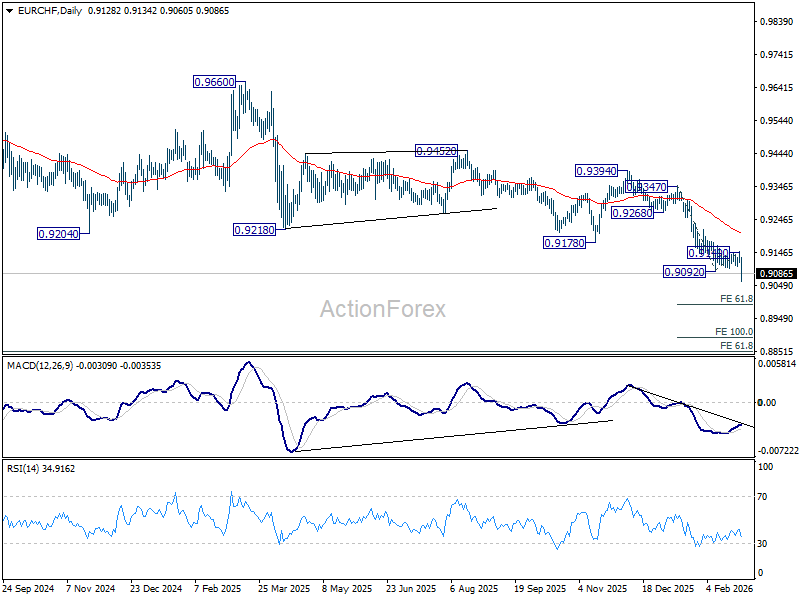
Should downside momentum accelerate, attention would shift toward 100% projection at 0.8894. A move of that magnitude would signal a severe deterioration in market confidence and likely coincide with broader stress in European equities and energy markets.
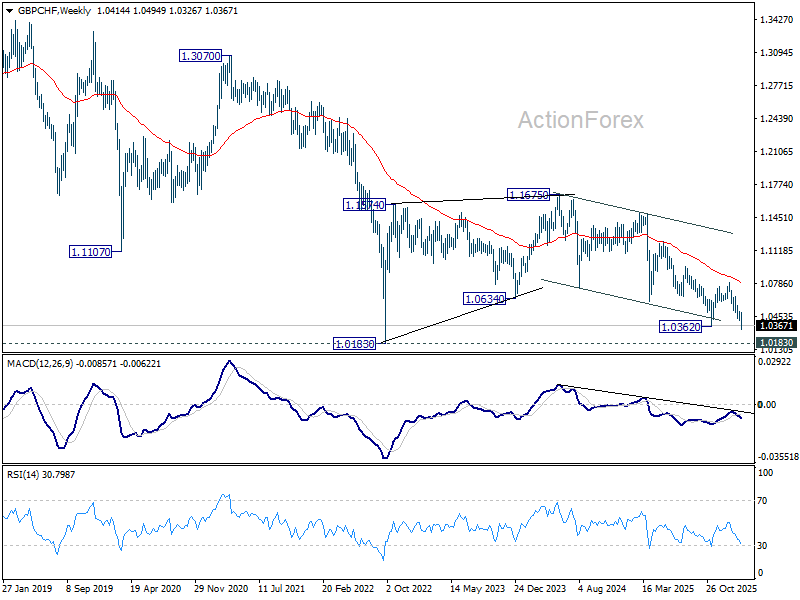
GBP/CHF is also approaching a structural inflection point. The 1.0183 level (2022 low), serves as critical support. A rebound should emerge from that area, at least on first test. However, decisive break below 1.0183 would mark resumption of the multi-decade downtrend, confirming that Sterling-specific weakness is compounding the broader flight to safety.
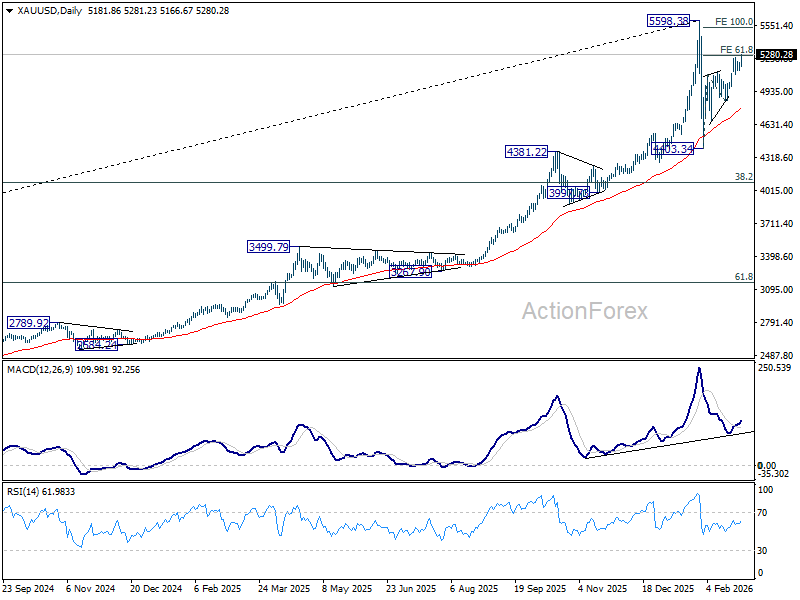
Gold Surges Toward 5,533 as Panic Bid Tests Structural Ceiling
Gold has extended its rally above 5,280 as safe-haven demand intensifies. The move reflects a classic panic bid driven by geopolitical shock, compounded by falling US yields.
From a structural standpoint, the advance from 4,403.34 is still viewed as the second leg of the corrective pattern from 5,598.38 high. The next major resistance lies near the 100% projection at 5,533.30. That level is critical. A rejection there would keep the broader corrective framework intact and suggest consolidation rather than breakout.
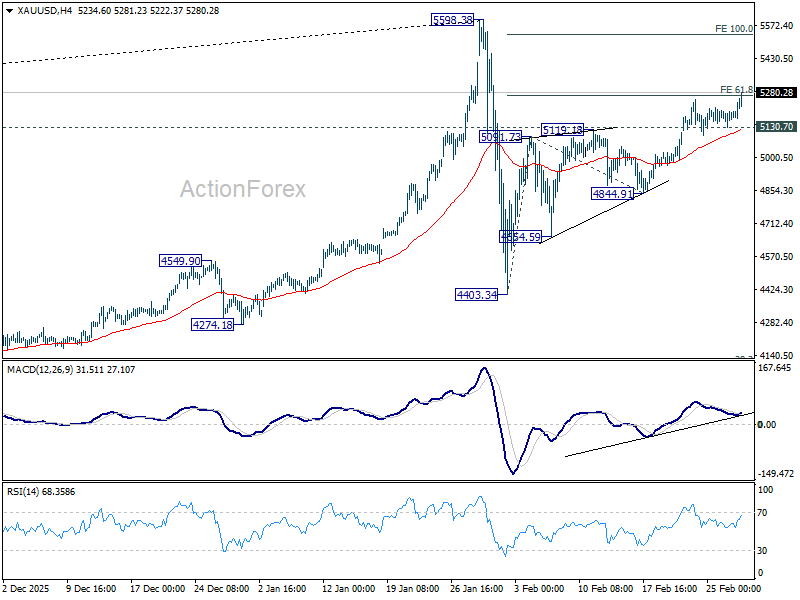
However, investors should remain alert to the risk of upside acceleration. In a true regime shock, technical ceilings can be overwhelmed by capital preservation flows. A decisive push through 5,533 and especially through 5,598.38 would invalidate the corrective view and signal that Gold is entering a new impulsive leg higher.
WTI Approaches 70 as War Premium Builds
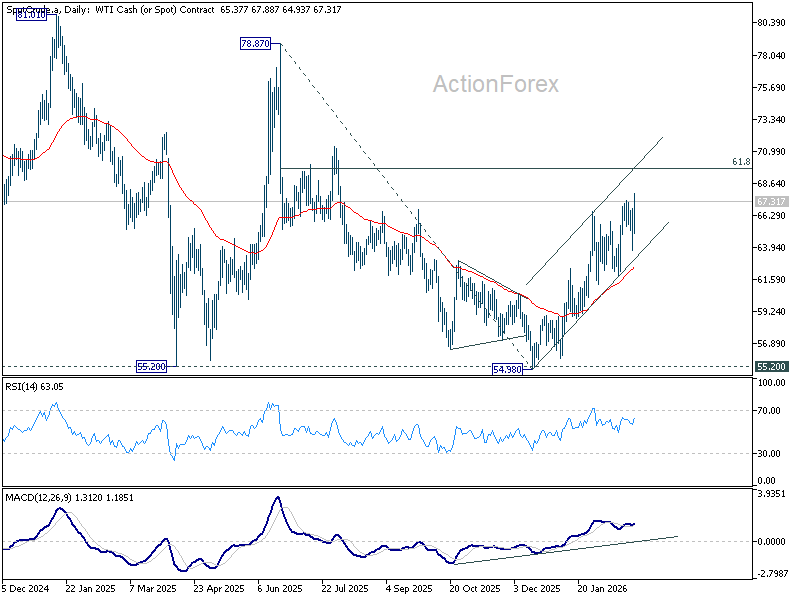
WTI crude has resumed its rally from 54.98, breaking above 64.36 last week despite an intra-week dip to 63.69. Technically, the next near term target lies at 61.8% retracement of 78.87 (2025 high) to 54.98 (2025 low) at 69.74. The 70 psychological level sits directly above and is likely to act as the first major resistance zone. Under normal volatility conditions, that region could cap upside on initial test.
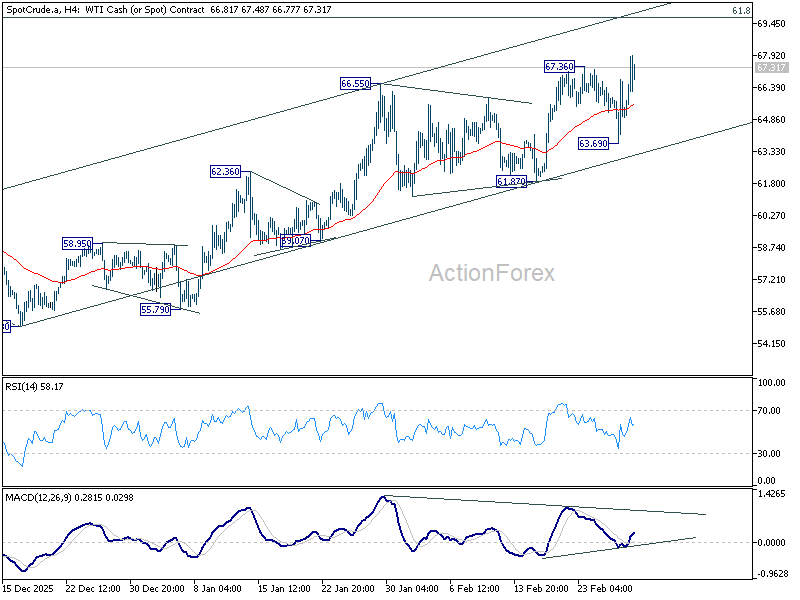
However, this environment is not normal. A decisive break above 70 would suggest that markets are shifting from precautionary pricing to full disruption pricing, opening the door toward a retest of the 78.87 high.
On the downside, a break below 63.69 would indicate short-term topping and imply that the initial war premium was partially front-run. For now, the path of least resistance remains higher, but the 70 level will determine whether this becomes a sustained energy shock.
USD/CAD Weekly Outlook
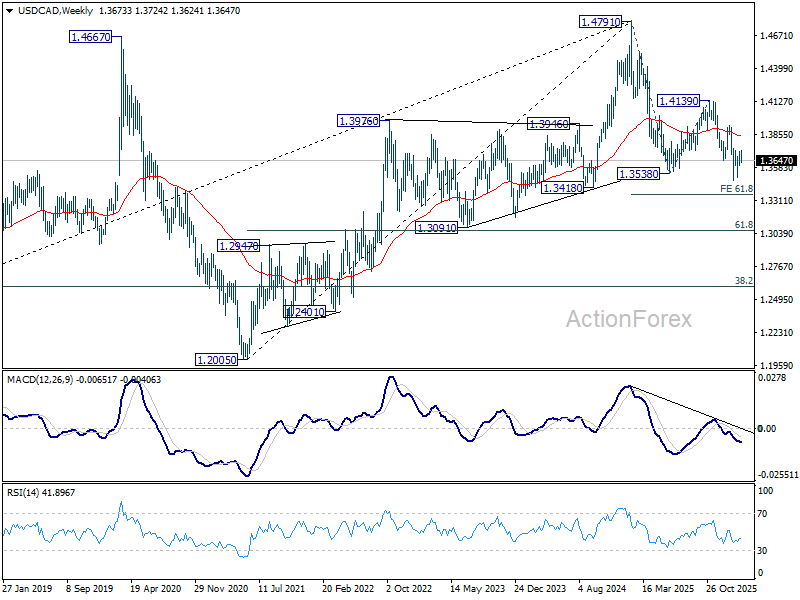
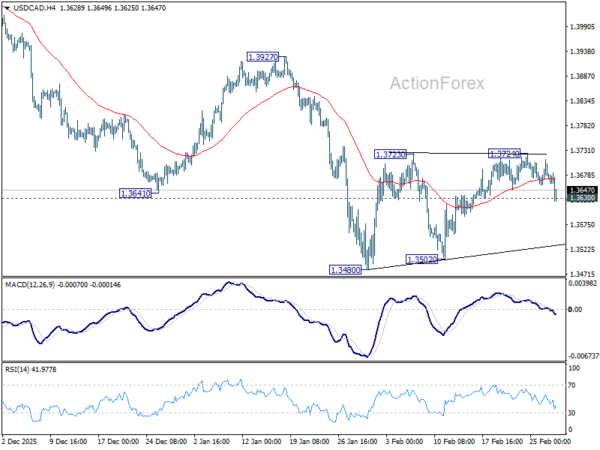
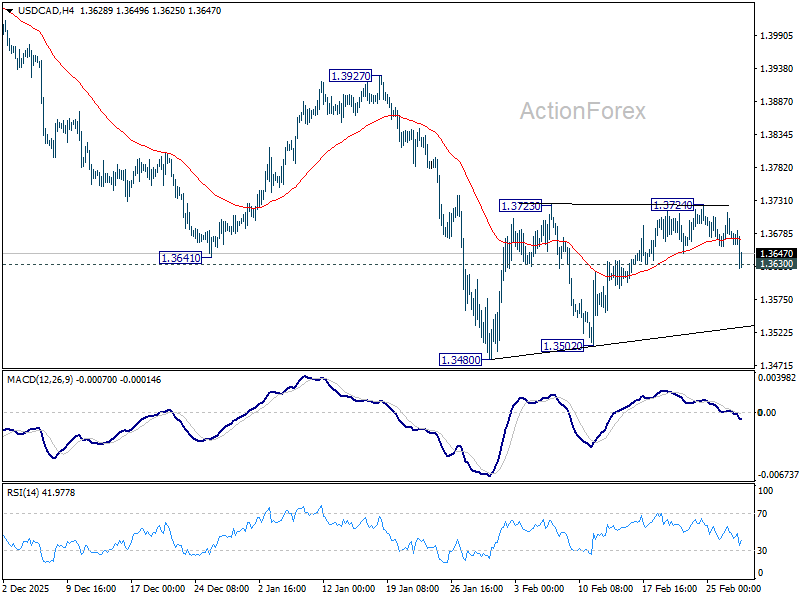
Despite the late dip in USD/CAD, it’s still holding on to 1.3630 minor support. Initial bias stays neutral this week first. Outlook is unchanged that price actions from 1.3480 are forming a consolidation pattern. Upside should be limited by 55 D EMA (now at 1.3728). On the downside, firm break of 1.3630 will bring retest of 1.3480 low first. Decisive break there will resume larger down trend 1.4791 to 61.8% projection of 1.4791 to 1.3538 from 1.4139 at 1.3365.
In the bigger picture, price actions from 1.4791 are seen as a corrective pattern to the whole up trend from 1.2005 (2021 low). Deeper fall could be seen as the pattern extends, to 61.8% retracement of 1.2005 to 1.4791 at 1.3069. For now, medium term outlook will be neutral at best, until there are signs that the correction has completed, or that a bearish trend reversal is confirmed.
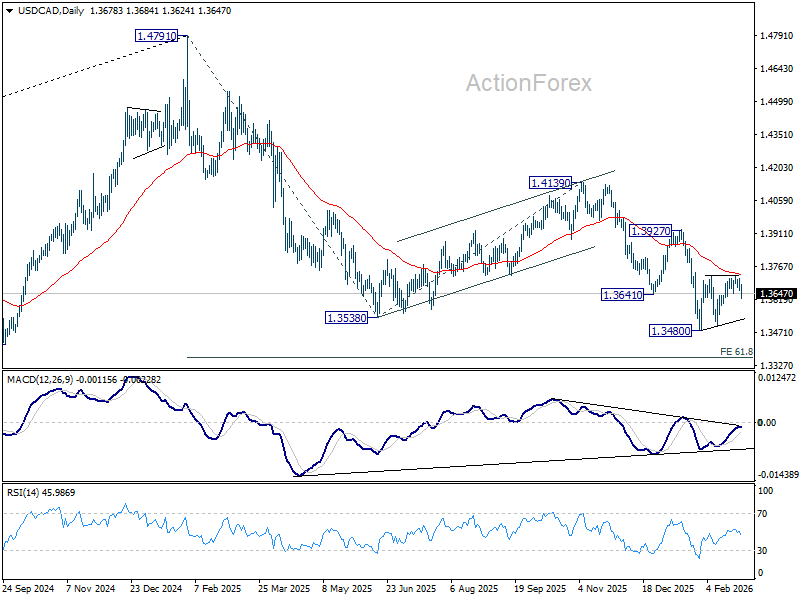
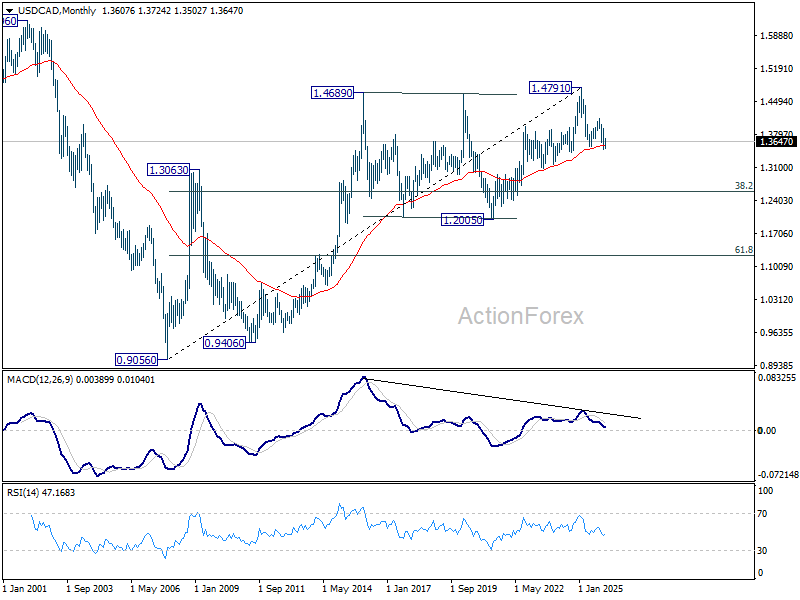
In the long term picture, rising 55 M EMA (now at 1.3569) remains intact. Thus, up trend from 0.9056 (2007 low) could still be in progress. However, considering bearish divergence condition M MACD, sustained trading below 55 M EMA will argue that the up trend has completed with five waves up to 1.4791, and turn medium term outlook bearish for correction to 38.2% retracement of 0.9056 to 1.4791 at 1.2600.