Quick overview
- A diverse group of major companies, including Walmart and BHP, are reporting earnings this week, providing insights into consumer spending and commodities demand.
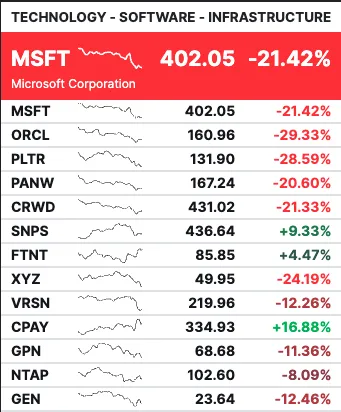
- Market volatility increased midweek, with significant declines in software and economically sensitive sectors despite positive job data.
- Defensive positioning has emerged as bonds outperformed equities, reflecting heightened investor caution amid recent stock pullbacks.
- Key economic indicators, including GDP and PCE inflation, are set to be released, which could influence market sentiment and equity valuations.
A diverse group of global heavyweights—including Walmart, BHP, and Palo Alto Networks—are set to report earnings, offering fresh insight into consumer strength, commodities demand, financial health, and tech spending trends.
Software Selloff Sparks Broader Contagion
Midweek, market tone shifted abruptly. Initial jobless claims came in on the softer side, but the data failed to move markets meaningfully. Instead, the real volatility emerged from earnings reactions.
AppLovin Corporation became a focal point after plunging 16%—despite beating both revenue and earnings expectations. The sharp drop underscored how valuation sensitivity has intensified. In this environment, even strong results are not enough if expectations are stretched.
Selling pressure soon spread beyond software. Trucking companies and commercial real estate names saw intraday declines approaching 20% in some cases. Economically sensitive sectors appeared to price in a sudden slowdown.
This reaction stood in contrast to the previous day’s non-farm payrolls report, which had signaled continued labor market resilience. The disconnect between economic data and price action highlighted elevated investor anxiety.
“Nothing Safe Except Bonds”
By week’s end, defensive positioning dominated flows. Bonds outperformed equities, reflecting a temporary shift toward safety.
The speed of the decline unsettled investors. Many high-profile stocks have now fallen 10–20% from recent record highs. Even the Dow and S&P 500 retreated roughly 3% from peak levels shortly after setting new records.
While such pullbacks often reflect sentiment resets rather than deteriorating fundamentals, the rapid nature of the move reinforced caution.
Encouragingly for bulls, the Dow’s retracement stalled near key technical levels, suggesting longer-term buyers remain active. Holding support above the 50,000 breakout zone would strengthen the case for consolidation rather than a broader trend reversal.
Key Market Events to Watch This Week:
This week’s earnings lineup spans retail, mining, banking, credit markets, delivery services, cybersecurity, and semiconductors—offering a comprehensive snapshot of global economic momentum.
Investors will be watching not only headline EPS results but, more importantly, forward guidance and management commentary. In a market increasingly sensitive to growth expectations and capital discipline, these reports could help shape sentiment for the weeks ahead.
🛒 Walmart Inc. (WMT)
- Report: Q4 2026 Earnings
- Timing: Before Market Open (BMO)
- EPS Expected: $0.73
- Market Cap: ~$1.07 trillion
Why it matters:
- Bellwether for U.S. consumer spending trends.
- Guidance on inflation, pricing power, and discretionary demand will be closely watched.
- Commentary on margins and inventory management could influence the broader retail sector.
⛏️ BHP Group Limited (BHP)
- Report: H1 2026 Earnings
- Timing: TNS
- Market Cap: ~$188.5 billion
Why it matters:
- Major signal for global commodities demand, especially iron ore and copper.
- Insight into China’s industrial activity and infrastructure trends.
- Updates on capital expenditure and production costs could move the mining sector.
🏦 Lloyds Banking Group plc (LYG)
Report: Q4 2025 Earnings
- Timing: Before Market Open (BMO)
- EPS Expected: $0.11
- Market Cap: ~$101.07 billion
- Why it matters:
- Barometer for UK banking conditions and mortgage activity.
- Net interest margins and credit quality trends will be in focus.
- Forward guidance could signal how rate dynamics are impacting profitability.
📊 Moody’s Corporation (MCO)
- Report: Q4 2025 Earnings
- Timing: Before Market Open (BMO)
- EPS Expected: $3.44
- Market Cap: ~$76.49 billion
Why it matters:
- Indicator of global debt issuance and capital markets activity.
- Demand for ratings and analytics products reflects corporate financing trends.
- Outlook may reveal confidence levels across credit markets.
🚚 DoorDash, Inc. (DASH)
- Report: Q4 2025 Earnings
- Timing: After Market Close (AMC)
- EPS Expected: $0.58
- Market Cap: ~$69.11 billion
Why it matters:
- Insight into consumer behavior in food delivery and convenience spending.
- Focus on order growth, profitability, and expansion initiatives.
- Commentary on competition and margin sustainability will be key.
🔐 Palo Alto Networks, Inc. (PANW)
- Report: Q2 2026 Earnings
- Timing: After Market Close (AMC)
- EPS Expected: $0.94
- Market Cap: ~$134.91 billion
Why it matters:
Gauge of enterprise cybersecurity spending trends.
Investors will assess billings growth and AI-driven security solutions.
Forward guidance may influence broader tech sentiment.
🔌 Analog Devices, Inc. (ADI)
- Report: Q1 2026 Earnings
- Timing: Before Market Open (BMO)
- EPS Expected: $2.30
- Market Cap: ~$165.06 billion
Why it matters:
- Key signal for semiconductor demand across industrial and automotive markets.
- Commentary on supply chains and inventory normalization will be critical.
- Outlook may provide clues about the broader chip cycle recovery.
Key Catalysts for the Week Ahead
With volatility elevated, macro catalysts could play an outsized role in shaping direction.
FOMC Minutes (Wednesday)
Investors will closely analyze the latest meeting minutes from the Federal Reserve.
The Fed recently left rates unchanged at 3.50–3.75% in a 10–2 vote, with two governors dissenting in favor of a 25-basis-point cut. Markets will scrutinize the minutes for clues about internal divisions, inflation risks, and the likely path of future rate decisions.
Any shift in tone—either more dovish or more cautious—could influence equity valuations, particularly in rate-sensitive sectors.
U.S. GDP (Friday)
Preliminary fourth-quarter GDP data will offer a fresh look at economic momentum. Growth is expected to cool from the prior quarter’s strong 4.4% annualized pace.
A moderate slowdown would likely be interpreted as healthy normalization. However, a sharper-than-expected deceleration could intensify recession concerns and amplify volatility.
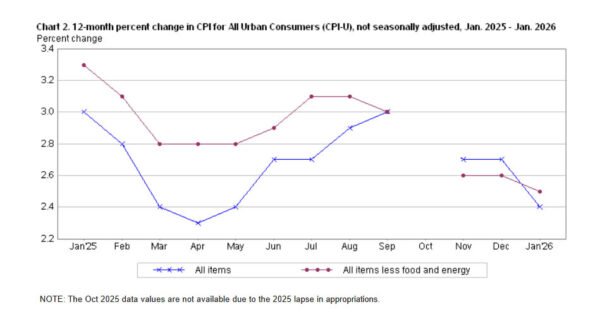
PCE Inflation (Friday)
Also due Friday is the Personal Consumption Expenditures (PCE) index—the Fed’s preferred inflation gauge.
Consensus expectations suggest December PCE could show firmer price pressures than recent CPI readings, partly due to strength in food and producer prices. If inflation proves sticky, rate-cut expectations may be pushed further out, potentially weighing on equities.
Conversely, softer data could provide relief and support risk assets.
Gold Resumes the Decline Again As Safe Havens Lose Status
Although demand for safe haven assets is still high, gold fell precipitously from record highs following the Fed’s most recent rate cut comments, as profit-taking was prompted by Powell’s cautious tone. In December, gold jumped above $4.3800 following the Federal Reserve’s announcement of a 25 basis point rate decrease. But the impetus soon waned, and prices dropped back to $4,004. The 20 daily SMA (gray) held as support last week and buyers returned and pushed XAU above the $5,000 mark for the first time during Asian hours and extended the rally in New York, printing a fresh record high near $5,111 before retreating below $5,000 late in the session. But buyers returned and XAU climbed to $5,598 but pulled back below $5,000 again.
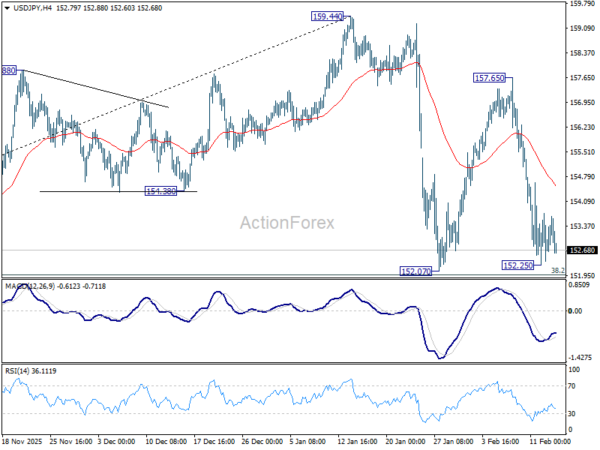
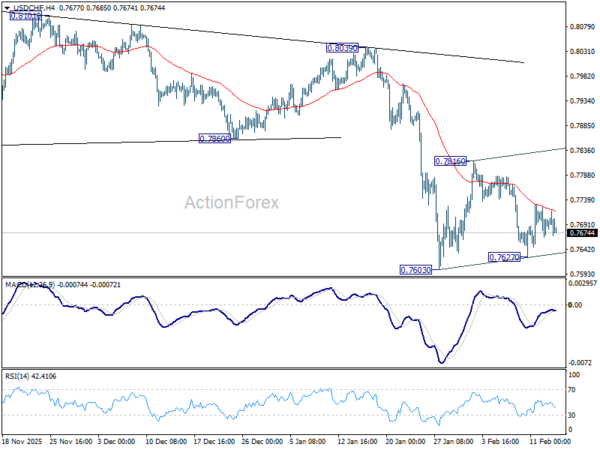
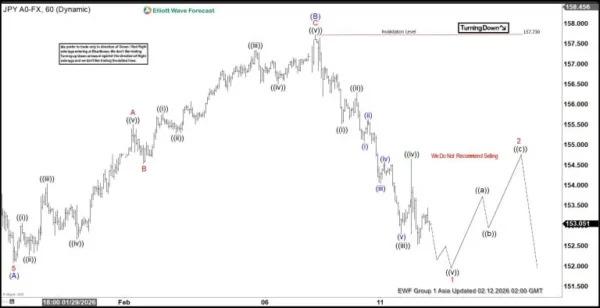
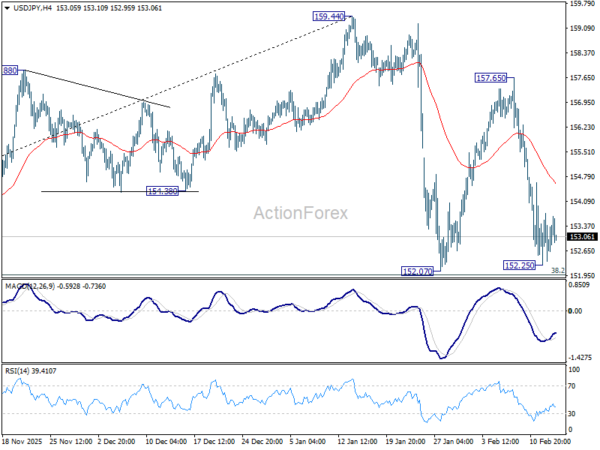
USD/JPY Returns Back Down
Foreign exchange markets saw sharp swings. Early in the week, U.S. yield differentials and Japanese capital outflows pushed the dollar above ¥150, but disappointing U.S. jobs data triggered profit-taking, causing the USD/JPY to slide by four yen from its peak. However, the new BOJ governor the JPY has weakened and USD/JPY soared to 154 and we decided to close our buy signal for more than 80 pips as the pair found support at the 20 daily SMA (gray) and has rebounded more than 200 pips off that MA but reversed after the 25 bps rate cut from the FED. The price approached $160 but reversed after the BOJ meeting and fell 8 cents but found support at $152 at the 100 daily SMA (red) and rebounded above 156 but have reversed down again this week after the Japanese elections.
USD/JPY – Daily Chart
Cryptocurrency Update
Bitcoin Returns Under $70K
Cryptocurrencies remained highly active over the summer. Bitcoin (BTC) climbed to fresh highs of $123,000 and $124,000 in July and August, supported by institutional inflows and technical strength. However, remarks from Treasury Secretary Scott Bessent ruling out U.S. increases to BTC reserves triggered a steep pullback, sending the coin down to $80K before finding support at the 100 weekly SMA (green). A rebound followed, sending BTC near $100 is the first major text for Bitcoin buyers. However BTC returned lower and fell below $80K, breaking below the but the 100 weekly SMA (green) but the decline stopped at the $60K support where the 200 weekly SM A(purpe) stands and rebounded above $70K.
BTC/USD – Weekly Chart
Ethereum Slips Below $2,000
Ethereum (ETH) has been similarly strong, surging toward $4,800, its highest since 2021 and near its all-time peak of $4,860. Despite a dip last week, ETH found support at the 20-day SMA, with retail enthusiasm and renewed institutional participation driving fresh upside momentum. Last week we saw a dive below $2,000 but buyers returned n d pushed the price above $2K again.
ETH/USD – Weekly Chart
Skerdian Meta
Lead Analyst
Skerdian Meta Lead Analyst.
Skerdian is a professional Forex trader and a market analyst. He has been actively engaged in market analysis for the past 11 years. Before becoming our head analyst, Skerdian served as a trader and market analyst in Saxo Bank’s local branch, Aksioner. Skerdian specialized in experimenting with developing models and hands-on trading. Skerdian has a masters degree in finance and investment.