Forex Risk Management: The 3-Step Process to Successful Trading

Quick Summary:

Success in Forex isn’t about predicting the win; it’s about defining where you are wrong. This guide covers the 3-step risk process: Defining (Technical levels), Limiting (Position sizing/proximity), and Accepting (Mental edge).

A Text That Boosted My Ego (And Proved My Point)

A few years ago, at a social gathering, I met someone through a mutual friend who traded Forex. Naturally, we got to talking shop. During the conversation, I hammered home a point I make to anyone who will listen: risk management is the most important aspect of trading.

I didn’t hear from her for a long time. But this week, I received a surprise text that gave my ego a bit of a boost. She wrote:

“I wanted to acknowledge something you said to me… You told me that risk management was the most important aspect of trading. At the time, I probably didn’t even know what that meant. But I do now, and I have finally come to understand exactly what you were trying to tell me!”

In my reply, I told her:
“We—as a people—tend to prefer focusing on the reward in trading (and in life). It’s more positive, after all. But if you focus on the risk, you know exactly where you are wrong. If you can live with that, and you aren’t ‘risked out’ (stopped out), you still get your rewards. Targeting where you are going is just the next step.”

Cracking the “Trader Code”

If you follow my videos or my posts, you know I’m a stickler for defining risk. I might write something like this in a market update:

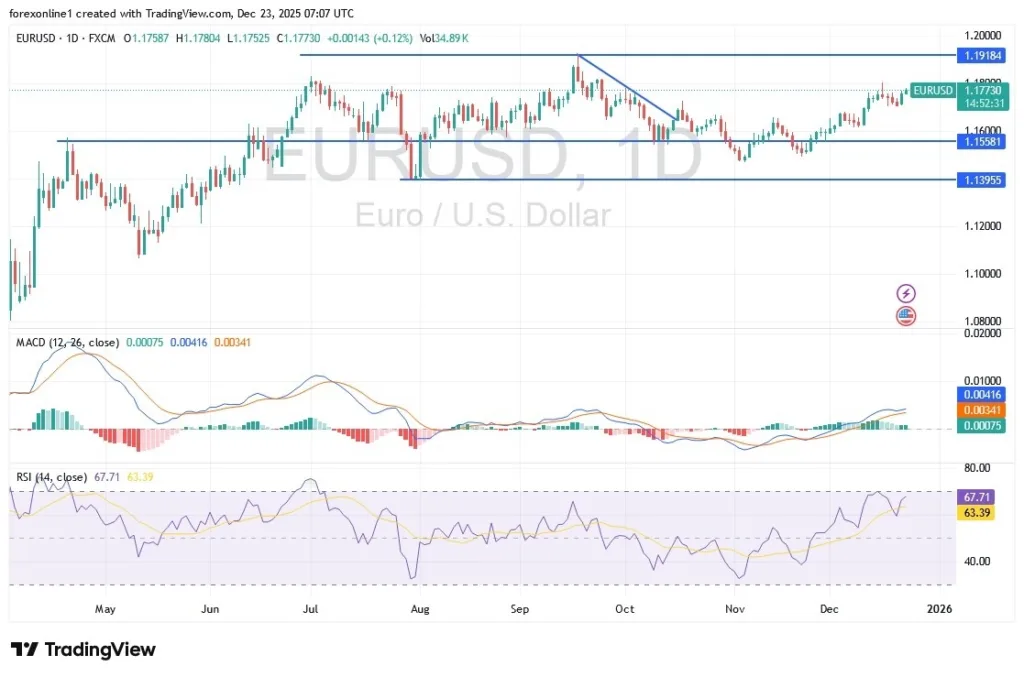
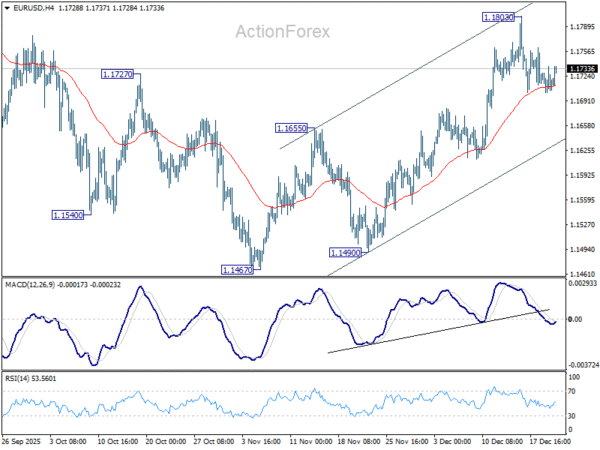
“…The bias for the EURUSD is negative following the break of those two moving averages and remains so below the rising trend line. Traders would now NOT want to see the price moving back above those moving averages—at least in the short term. That would disappoint the sellers on the break to the downside and likely lead to more upside momentum.”

To a casual observer, that’s just technical analysis. But in “trader code,” those words actually mean: “This is your risk-defining level RIGHT HERE. This is your stop-loss area.”

Traders need to know where they are wrong. They need to know the exact point where a negative bias turns positive, or where a positive bias turns sour. Technicals define those action areas.

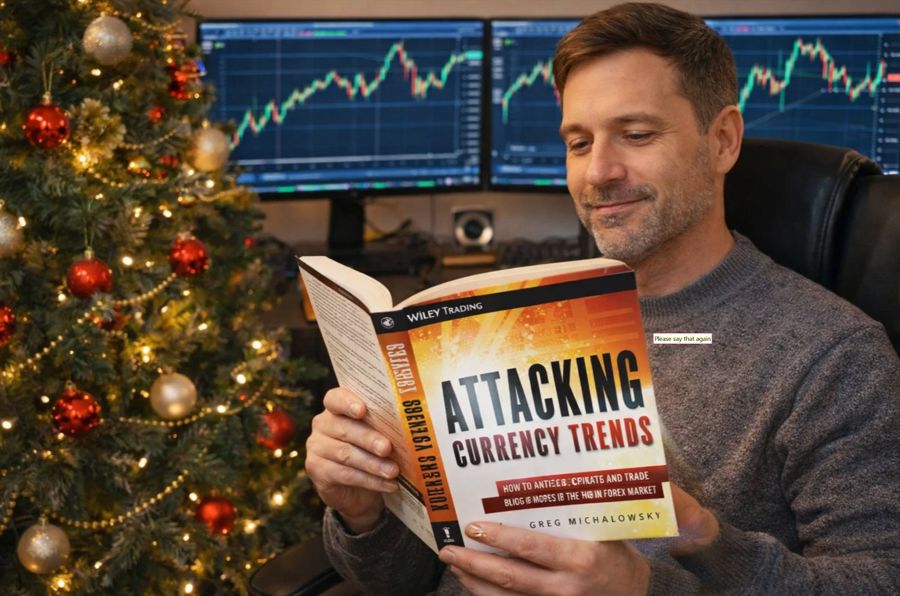
One of the core messages in my book, Attacking Currency Trends, is that successful trading starts with risk, not reward. Before you ever think about profit targets, you must be clear on what the risk is, how it is limited, and whether it is acceptable. This framework creates the discipline and emotional control needed in volatile FX markets where fear often drives bad decisions.

The 3-Step Risk Process

1. Defining Risk: Know Exactly Where You Are Wrong

Risk must be defined before entering a trade. In Attacking Currency Trends, I define risk technically—it is a specific price level that invalidates your trade idea.

Risk is not a random dollar amount; it is a price level. On investinglive.com, I take the approach that readers want to know what the chart is telling them right now and why. That story always revolves around key technical levels: trend lines, moving averages, swing highs/lows, or Fibonacci retracements.

If price breaches that level, the premise of the trade is wrong—not just in my eyes, but in the eyes of the “market.” By defining risk at entry, you answer the most important question first: Where am I wrong? It takes discipline and humility to accept that defeat, but you need as much conviction in your exit point as you do in your entry.

2. Limiting Risk: The Math of Fear

Once risk is defined, you must strive to limit it. I tell traders: we must take risk to make money, but we should try to limit that risk as much as humanly possible.

  • Logic over Emotion: Stops are placed at technical levels “followed by many,” not where you “feel” like putting them.

  • Proximity is Key: Trading as near to a risk-defining level as possible limits your downside and makes reaching profit objectives easier.

Think about the math: If you risk 20 pips, you only need a 20-pip move to reach a 1:1 reward-to-risk ratio. If you enter 50 pips away from your risk level, you need a massive 100-pip move just to reach a 2:1 target.

Trading near your risk level is the ultimate “fear killer.” If you don’t think fear impacts your trading, think again. Defining and limiting risk are the two mechanical steps that keep fear from driving the bus.

3. Accepting Risk: The Mental Edge

Defining and limiting risk is mechanical. Accepting risk is psychological.

You need to be able to tell yourself: “I have done the work to define my risk. I have limited my monetary exposure. I accept this risk in my core being.” Once you do that, the fear disappears because:

  • The risk is already “paid for” mentally the moment you click ‘buy’ or ‘sell.’

  • There is no “hoping,” bargaining, or second-guessing.

  • Losses are treated as business expenses, not personal failures.

Why This Framework Matters

Trends can only be “attacked” consistently when risk is under control. Traders who skip these steps might win occasionally, but they won’t survive the long game.

  • Defined Risk creates clarity.

  • Limited Risk preserves capital.

  • Accepted Risk frees the mind to execute.

The Bottom Line: When risk is defined, limited, and accepted, you put the probabilities on your side and give yourself the best chance to succeed over time.

Merry Christmas and Happy New Year to all. Peace on Earth. Goodwill to all.

Attacking Currency Trends

Source link

Visited 1 times, 1 visit(s) today

Related Article

An electronic board at a Hana Bank dealing room in Seoul shows the Korean won against the US dollar on Wednesday just before the close of daytime trading. The won closed at 1,449.8 per dollar. (Yonhap)

Won strengthens past 1,450 after rare FX warning

Capital gains tax relief rolled out to rein in retail-driven dollar demand An electronic board at a Hana Bank dealing room in Seoul shows the Korean won against the US dollar on Wednesday just before the close of daytime trading. The won closed at 1,449.8 per dollar. (Yonhap) A rare, verbal intervention by South Korean

Image used for representational purpose only. File

Rupee falls 16 paise to close at 89.79 against U.S. dollar

Image used for representational purpose only. File | Photo Credit: Reuters The rupee pared initial gains and settled for the day lower by 16 paise at 89.79 (provisional) against the U.S. dollar on Wednesday (December 24, 2025), fuelled by persistent capital withdrawals from foreign investors, alongside heightened greenback demand from bullion importers. Forex traders said

GBP/USD Forex Signal 24/12: Rally Gains Steam (Chart)

GBP/USD Forex Signal 24/12: Rally Gains Steam (Chart)

Created on December 24, 2025 Bullish view Buy the GBP/USD pair and set a take-profit at 1.3650. Add a stop-loss at 1.3450. Timeline: 1-2 days. Bearish view Sell the GBP/USD pair and set a take-profit at 1.3450. Add a stop-loss at 1.3650. The GBP/USD pair continued its recent rally as the US dollar softened following

Gold Rallies to New Peak as Traders Await US GDP Catalyst

Gold Rallies to New Peak as Traders Await US GDP Catalyst

Key Highlights Gold started a fresh surge above the $4,450 resistance. The bulls could now aim for a move above $4,500. WTI Crude Oil prices started a recovery wave above $57.50. The US GDP could grow by 3.2% in Q3 2025 (Preliminary), down from 3.8%. Gold Price Technical Analysis Gold prices started a fresh rally

This image is used for representational purpose only.

Rupee rises 12 paise to 89.51 against U.S. dollar in early trade

This image is used for representational purpose only. | Photo Credit: Getty Images/iStockphoto The rupee appreciated 12 paise to 89.51 against the U.S. dollar in early trade on Wednesday (December 24, 2025), supported by the RBI’s major liquidity announcement and the weakness of the American currency in the overseas market. Forex traders said the rupee

An electronic trading board at Hana Bank headquarters in central Seoul shows the won-dollar exchange rate falling to the 1,450 range following financial authorities’ intervention on Wednesday. Yonhap

Authorities intervene in FX market, exchange rate drops to 1,450-won range

An electronic trading board at Hana Bank headquarters in central Seoul shows the won-dollar exchange rate falling to the 1,450 range following financial authorities’ intervention on Wednesday. Yonhap Financial authorities made a verbal intervention on the foreign exchange market over a drastically weakened won, prompting the won-dollar exchange rate to fall to the 1,450 range

An electronic board at Woori Bank's dealing room shows the won quoted at 1,483.6 per dollar shortly after daytime trading's close, Tuesday. (Yonhap)

Korean won slips to 8-month low

An electronic board at Woori Bank’s dealing room shows the won quoted at 1,483.6 per dollar shortly after daytime trading’s close, Tuesday. (Yonhap) The Korean won fell to an 8-month low Tuesday, as dollar-buying flows amplified the downward pressure on the won amid thinning market liquidity toward year-end. The won wrapped up local daytime trading

NZD/USD Forecast 23/12: Range Trading Persists (Video)

NZD/USD Forecast 23/12: Range Trading Persists (Video)

Created on December 23, 2025 I’m not calling for the New Zealand dollar to implode from here and start falling drastically, but I do think that short-term choppiness will offer plenty of opportunity for range-bound traders. The New Zealand dollar has been very strong during the trading session here on Monday as the US dollar

EUR/USD Analysis 23/12: Amid Bullish Momentum (Chart)

EUR/USD Analysis 23/12: Amid Bullish Momentum (Chart)

Created on December 23, 2025 EUR/USD Analysis Summary Today Overall Trend: In an upward technical correction. Support Levels for EUR/USD Today: 1.1710 – 1.1650 – 1.1580 Resistance Levels for EUR/USD Today: : 1.1800 – 1.1860 – 1.2000 EUR/USD Trading Signals: Buy EUR/USD from the support level of 1.1660 with a target of 1.1820 and a

Gold Analysis 23/12: Tests New Record All-Time High (Chart)

Tests New Record All-Time High (Chart)

Created on December 23, 2025 Today’s Gold Analysis Overview: The overall of Gold Trend: Strongly bullish. Today’s Gold Support Points: $4430 – $4360 – $4220 per ounce Today’s Gold Resistance Points: $4520 – $4590 – $4660 per ounce Today’s Gold Trading Signals: Sell gold from the resistance level of $4600 with a target of $4200

USD/CAD Forecast 23/12: Holiday Trading Fuels Range (Chart)

Holiday Trading Fuels Range (Chart)

Created on December 23, 2025 The U.S. dollar has drifted a bit lower against its northern counterpart on Monday as we continue to see a lot of choppy but slightly negative behavior in this market. The U.S. dollar has drifted a bit lower against its northern counterpart on Monday as we continue to see a

The TRADE predictions series 2026: What’s in store for foreign exchange

The TRADE predictions series 2026: What’s in store for foreign exchange

Simon Jones, head of FX product and liquidity, LSEG   Next year will mark a pivotal moment for the foreign exchange market as the hedging of FX swaps reaches a tipping point toward full electronic execution. The industry has been moving steadily in this direction, but next year will see widespread adoption driven by efficiency and risk

EUR/USD Forex Signal 22/12: Extremely Bullish (Chart)

EUR/USD Forex Signal 22/12: Extremely Bullish (Chart)

Created on December 22, 2025 Bullish View Buy the EUR/USD pair and set a take-profit at 1.1800. Add a stop-loss at 1.1600. Timeline: 1-2 days. Bearish View Sell the EUR/USD pair and set a take-profit at 1.1600. Add a stop-loss at 1.1800. The EUR/USD exchange rate pulled back after the European Central Bank (ECB) delivered

Fed’s Nordstrom: Longer Hours and Faster Trading Increase Risks in FX

Fed’s Nordstrom: Longer Hours and Faster Trading Increase Risks in FX

Categorised: The Stream | Tags: AI, Anna Nordstrom, automation, faster trading, FX markets, longer hours, New York Fed, riskPosted by Colin Lambert. Last updated: December 23, 2025 New technologies such as AI, stablecoins and tokenised deposits are likely to affect FX markets and market structure, but while bringing some potential benefits, risks could also rise,

GFXC Urges Early Preparation for European T+1 Switch

GFXC Urges Early Preparation for European T+1 Switch

Categorised: The Stream | Tags: best practice, CLS, Europe, FX, GFXC, preparation, settlement, T+1, UKPosted by Colin Lambert. Last updated: December 22, 2025 In a new paper published by its Settlement Working Group, the Global Foreign Exchange Committee highlights the need for FX market participants to begin their preparations “as early as possible” for the

USD/JPY Climbs Towards a Key High

USD/JPY Climbs Towards a Key High

On 15 December, we highlighted that USD/JPY was sliding towards a key support area near the lower boundary of its ascending channel. Since then (as shown by the arrow), the pair has reversed higher, gaining around 1.5% and moving close to an important high set last month. Notably, the advance has occurred despite two bearish

Silver Price Forecast: $70.70 in Sight After $68.98 Breakout Shakes Bears

Silver Price Forecast: $70.70 in Sight After $68.98 Breakout Shakes Bears

Silver prices are ending the week on firm footing, with XAG/USD trading near $68.98 after decisively breaking above a long-watched… Written by: Arslan Butt • Monday, December 22, 2025 • 2 min read • Last updated: Monday, December 22, 2025 Add an article to your Reading List Register now to be able to add articles

GBP/USD Forex Signal 22/12: Neutral Outlook (Chart)

GBP/USD Forex Signal 22/12: Neutral Outlook (Chart)

Created on December 22, 2025 Bullish view Buy the GBP/USD pair and set a take-profit at 1.3600. Add a stop-loss at 1.3250. Timeline: 1-2 days. Bearish view Sell the GBP/USD pair and set a take-profit at 1.3250. Add a stop-loss at 1.3600. The GBP/USD exchange rate remained in a tight range after the US published

EUR/USD Daily Outlook - ActionForex

EUR/USD Daily Outlook – ActionForex

Daily Pivots: (S1) 1.1695; (P) 1.1717; (R1) 1.1730; More…. Intraday bias in EUR/USD stays neutral as range trading continues below 1.1803. . On the upside, break of 1.1803 will extend the rally from 1.1467 to retest 1.1917 high. However, firm break of 55 D EMA (now at 1.1640) will turn bias back to the downside

USD/ZAR Analysis 22/12: Market Sentiment (Chart)

USD/ZAR Analysis 22/12: Market Sentiment (Chart)

Created on December 22, 2025 The USD/ZAR is near the 16.72100 vicinity as of this writing early on Monday as trading volumes start to suffer from a lack of full market participation because of the upcoming holiday season. The bearish trend of the USD/ZAR remains an intriguing speculative wager. The currency pair is around the

0
Would love your thoughts, please comment.x
()
x