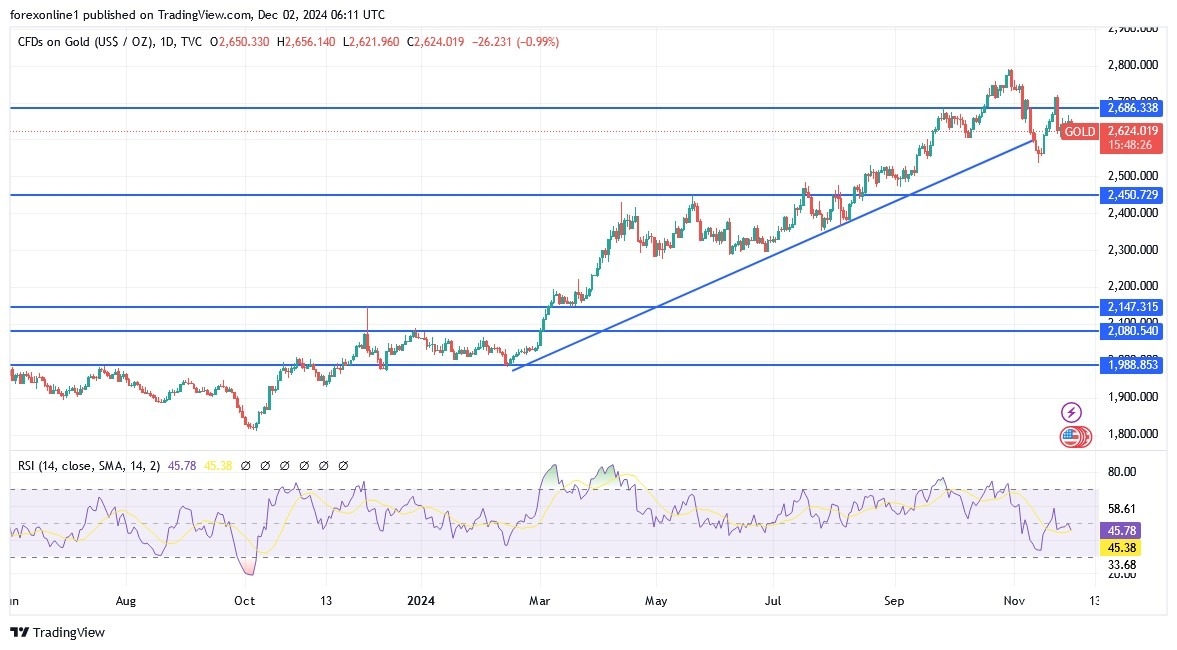
Forecast for Coming Days (Chart)

  • Trump’s harsh threats against BRICS countries regarding the exclusive use of the US dollar have contributed to a strong positive momentum for the US dollar, causing gold prices to decline to the support level of $2622 per ounce.
  • This move abandoned the gains of the previous Friday’s session, which reached the resistance level of $2666 per ounce.
  • Concurrently, the gold price index is threatened with a return to the vicinity of the $2600 per ounce support level.

Gold Analysis Today 02/12: Forecast for Coming Days (graph)

Trump’s Trade Wars Boost the Strength of the US Dollar

According to reliable trading platforms, the US dollar index gained positive momentum from increased demand for the US dollar as a safe haven in response to new trade threats from Trump, who threatened to impose a 100% tariff on all BRICS countries if they implemented their recommendations for a unified currency among them, thus abandoning the US dollar. In addition to Trump’s trade wars and the dollar’s gains from these wars, the US dollar price will be affected by the announcement of US jobs figures at the end of the week and statements by several US Federal Reserve officials, which will determine the expectations for the future of the bank’s upcoming decisions.

Expectations from US Federal Reserve Decisions

Recently, and according to economic calendar data, data showed that progress in reducing US inflation has stalled, indicating a more gradual pace in the US interest rate cut cycle. Currently, financial markets indicate a 65% probability of a 25-basis point cut in US interest rates at the Federal Reserve’s meeting in the last month of 2024, with only two more interest rate cuts fully priced for 2025.

Factors Affecting Gold Prices Momentarily

The most prominent factors affecting the gold market are the rise in the US dollar index at the beginning of this week to above 106.40, which is better than last week’s losses. Moreover, the gains in the US dollar price came with the continued resilience of the US economy and the deterioration of the outlook for some of the world’s economies recently. In addition to the strength of the dollar from Trump’s trade threats, which in turn support a stronger US dollar. Additionally, the US dollar benefited from the decline in the euro price, which was affected by political uncertainty in France. At the same time, the US dollar rallied against the Japanese yen, as traders remained divided over the timing of the next interest rate hike by the Bank of Japan.

Another factor affecting the gold market is US Treasury yields. According to recent trades, the yield on 10-year US Treasury bonds has risen to more than 4.2%, reflecting a two-week decline, as investors bet on the strong economic performance of the United States before the end of 2025. Furthermore, the rise in bond yields also came in the wake of the rally in the US dollar after Trump threatened members of the BRICS group with a 100% tariff if they created or supported a new currency that could replace the dollar.

Gold Price Technical Analysis Today:

We still adhere to the latest gold recommendations with no risk. Technically, we still recommend buying gold from every downward level. According to today’s gold analyst forecasts, the gold market will remain supported by increasing global geopolitical tensions and the levels of gold purchases by central banks for hedging, especially considering Trump’s disruptive administration in the next four years. Currently, the most important support levels on the daily chart are $2600, $2578, and $2555 per ounce, with the need to avoid risk and activate take-profit technically, stop-loss orders to ensure the safety of the trading account from any sudden price fluctuations. Conversely, and over that time period, the resistance of $2700 per ounce will remain the most important for the bulls to dominate the trend again.

Regarding the performance of technical indicators, the Relative Strength Index (RSI) is neutral, and the MACD indicator is heading upwards.

Ready to trade our Gold price forecast? We’ve made a list of the best Gold trading platforms worth trading with. 

Source link

Visited 1 times, 1 visit(s) today

Related Article

GBPUSD Daily Chart 12032024

GBP/USD Recovery Vulnerable as Bear Flag Formation Takes Shape

British Pound Outlook: GBP/USD GBP/USD may trade within the November range as it pares the decline from the start of the week, but the exchange rate may stage additional attempts to test the May low (1.2446) as a bear-flag formation appears to be taking shape. GBP/USD Recovery Vulnerable as Bear Flag Formation Takes Shape Keep

Natural Gas Forecast Today - 3/12: Gas Rebounds (Chart)

Natural Gas Forecast Today – 3/12: Gas Rebounds (Chart)

Created on December 03, 2024  This makes a huge difference, due to the fact that the futures markets of course have the most liquidity during the US session. Furthermore, it’s worth noting that the contract that you are trading in is more likely than not a derivative of the Henry Hub Natural Gas contract, which

Download the GFO report button

Global FX outlook for December 2024 – United States

As 2024 draws to a close, financial markets are experiencing the reverberations of significant geopolitical events and monetary policy shifts. The re-election of Donald Trump and his revived trade policy agenda have reignited volatility across currency markets, propelling the USD to two-year highs. Is your payments strategy sufficient to help ensure your business stays ahead

USD/JPY Forecast Today 03/12: Struggles Below 150 (Video)

USD/JPY Forecast Today 03/12: Struggles Below 150 (Video)

Created on December 03, 2024 The US dollar initially did try to recover against the Japanese yen during the trading session on Monday, but a lower than anticipated manufacturing PMI number may have been a bit of a problem. While that has seen the US dollar rocket higher against other currencies, I think this is

EUR/USD technical price analysis

EUR/USD Price Analysis: Recovery Above 1.05 May Stall

The euro plunged in the previous session due to political turmoil in France. The euro lost 3% of its value against the dollar in November. The US manufacturing PMI increased from 46.5 to 48.4. The EUR/USD price analysis shows some bullish momentum after a slide in the previous session.

EUR/USD Analysis Today 03/12: Bearish Trajectory (graph)

EUR/USD Analysis Today 03/12: Bearish Trajectory (Chart)

Created on December 03, 2024 As we predicted, the EUR/USD’s resilience wouldn’t last long. At the beginning of this crucial trading week, the currency pair attempted to surpass its recent gains of 1.0571, but with the continued pressure on the Euro due to political and economic factors, as well as the strength of the US

Get our guide to central banks and interest rates in Q4 2024

Technical Tuesday – December 3, 2024

The EUR/JPY is our featured technical chart, for not only a technical breakdown is looking increasingly likely, but the macro back backdrop makes for a bearish fundamental backdrop. In short, the euro is undermined because of Europe’s persistent economic and political challenges, while a potential rate hike from the Bank of Japan magnifies the yen’s

EUR/GBP Forecast Today 03/12: Holds Key Support (Video)

EUR/GBP Forecast Today 03/12: Holds Key Support (Video)

Created on December 03, 2024 As I look at the Euro against the British pound, I have to ask a lot of questions of whether or not we are breaking down more significantly than we have seen in the past. When I zoom out on the charts going back to approximately the summer of 2016,

20241203 DAX

DAX breaks 20,000 Amid Bullish Momentum and ECB Focus

Market Overview: Key Developments and Outlook Asian Session Highlights USD vs. Yen: The U.S. dollar remained near a six-week low against the yen. Euro Weakness: The euro declined, partly due to political instability in France, where Prime Minister Michel Barnier faces a potential vote of no confidence, which could introduce volatility in the euro and

USD/CAD Forecast Today 03/12: Near Highs (Video)

Created on December 03, 2024 The US dollar rallied rather significantly during the trading session in the early hours of Monday as we continue to see the US dollar swallow everything whole. This does make a certain amount of sense against the Canadian dollar because Canada has a whole litany of problems. But as you

USD/CAD technical outlook

USD/CAD Outlook: Manufacturing Surge Bolsters Loonie

Canada’s manufacturing PMI rose from 51.1 to 52.0 in November. The US manufacturing PMI rose to 48.4 after a previous reading of 46.5. US unemployment might increase in November. The USD/CAD outlook shows stronger-than-expected business activity in Canada’s manufacturing sector which is supporting the loonie. Meanwhile, the dollar eased

Silver Prices at $30.55: 3 Key Factors Driving the Bearish Trend

Silver Prices at $30.55: 3 Key Factors Driving the Bearish Trend

Silver (XAG/USD) remains under pressure, trading at $30.55 after hitting an intra-day low of $30.05. The primary driver behind this bearish move is the renewed strength of the US Dollar (USD), fueled by expectations of slower Federal Reserve rate cuts and rising US Treasury yields. The USD has gained additional support amid escalating geopolitical uncertainties.

Image used for representative purpose only

Rupee falls 4 paise to all-time low of 84.76 against U.S. dollar in early trade

Image used for representative purpose only | Photo Credit: Reuters The rupee fell 4 paise to all-time low of 84.76 against the U.S. dollar in early trade on Tuesday, as the strength of the American currency in the overseas market and unabated foreign portfolio outflows dented investor sentiments. Forex traders said the depreciation in rupee

BTC/USD Signal Today - 02/12: Bearish Turn Ahead (Chart)

BTC/USD Signal Today – 02/12: Bearish Turn Ahead (Chart)

Created on December 02, 2024 My previous BTC/USD signal on 21st November was not triggered, as none of the key levels which I had identified were reached that day. Today’s BTC/USD Signals Risk 0.50% per trade. Trades may only be taken prior to 5pm Tokyo time Tuesday. Long Trade Ideas Long entry after a bullish

AUD/USD technical forecast

AUD/USD Forecast: Strong Aussie Economy Meets Strong Dollar

Retail sales in Australia grew by 0.6% in October, above forecasts of a 0.4% increase. Market participants do not expect an RBA rate cut this year. US employers likely hired 195,000 new workers in November.  The AUD/USD forecast shows a volatile start to the week due to upbeat Australian

USD/MXN Analysis Today - 02/12: Calm Before U.S Data (Chart)

USD/MXN Analysis Today – 02/12: Calm Before U.S Data (Chart)

Created on December 02, 2024 After trading around the 20.73000 level into Wednesday of last week, the USD/MXN has begun to exhibit calmer trading sentiment among financial institutions, but the currency pair remains within higher elements still even as it trades lower. The USD/MXN has traded slightly lower and is touching the 202.41400 level early

GBP/USD Forecast Today 02/12: Eyes Breakout (Video)

GBP/USD Forecast Today 02/12: Eyes Breakout (Video)

Created on December 02, 2024 The cable rallied a bit during the trading session on Friday to break above the crucial 1.27 level. However, we have seen a little bit of pushback. So, this is what I call a holding pattern in the Forex world. We’ve broken out. And once you see this candlestick alarm

eurusd forecast chart

EUR/USD, FTSE Forecast: Two trades to watch

EUR/USD falls amid French political uncertainty French government is on the verge of collapse Eurozone manufacturing PMI contracts further USD rises as Trump threats trade tariffs EUR/USD looks to test 1.05 EUR/USD is falling at the start of the week after strong gains last week as the US dollar rebounds and amid French political uncertainty.

Forex Market Forecast for December 2024

Forex Market Forecast for December 2024

With the US election complete and Q3 earnings season drawing to a close, eyes are now turning to December and interest rates, with several major central banks set to decide on their latest interest rate moves, including the Bank of England, European Central Bank, Federal Reserve and Bank of Japan. Here’s what to watch: Inflation:

EUR/USD Analysis Today 02/12: Faces Downward Pressure (graph)

EUR/USD Analysis Today 02/12: Faces Downward Pressure

Created on December 02, 2024 At the beginning of this week, the US dollar regained its recent losses following Trump’s recent harsh threats and ahead of the start of trading for those who abandon the US dollar. As a result, the EUR/USD currency pair is stabilizing on a downward trend around the support level of

0
Would love your thoughts, please comment.x
()
x