EUR/USD Reclaims Ground While USD/JPY Momentum Fades

EUR/USD is recovering losses from 1.1500. USD/JPY is correcting gains from 159.00 and might decline further if it stays below 158.30.

Important Takeaways for EUR/USD and USD/JPY Analysis Today

  • The Euro struggled to stay in a positive zone and declined below 1.1700 before finding support.
  • There was a break above a connecting bearish trend line with resistance at 1.1580 on the hourly chart of EUR/USD at FXOpen.
  • USD/JPY started a decent increase above 157.00 before the bears appeared near 158.90.
  • There is a key contracting triangle forming with resistance near 158.30 on the hourly chart at FXOpen.

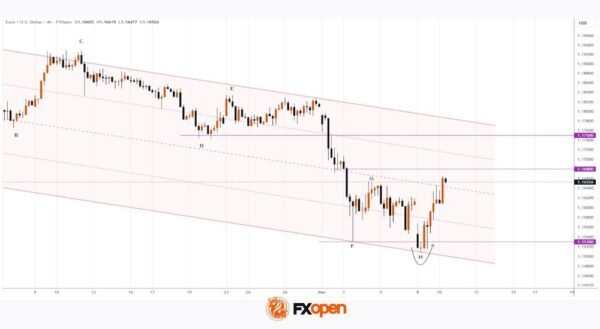
EUR/USD Technical Analysis

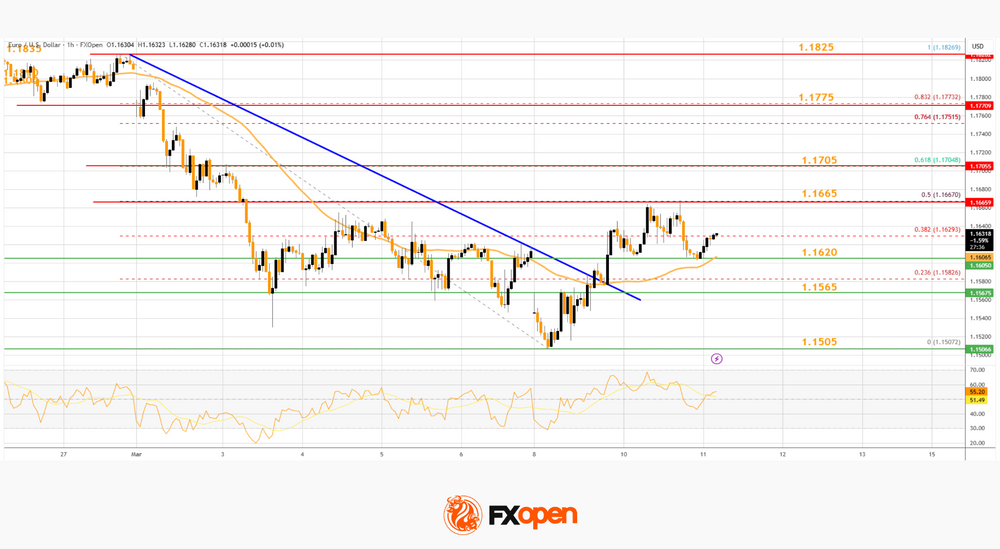
On the hourly chart of EUR/USD at FXOpen, the pair started a fresh decline from 1.1825. The pair broke below 1.1665 and the 50-hour simple moving average. Finally, it tested the 1.1500 zone. A low was formed at 1.1507, and the pair is now recovering losses.

There was a move above 1.1550 and a connecting bearish trend line at 1.1580. The pair surpassed the 38.2% Fib retracement level of the downward move from the 1.1826 swing high to the 1.1507 low. On the upside, the pair is now facing resistance near the 50% Fib retracement at 1.1665.

The first major hurdle for the bulls could be 1.1705. A break above 1.1705 could set the pace for another increase. In the stated case, the pair might rise toward 1.1775.

If not, the pair might drop again. Immediate support is near the 50-hour simple moving average and 1.1620. The next key area of interest might be 1.1565. If there is a downside break below 1.1565, the pair could drop towards 1.1505. The main target for the bears on the EUR/USD chart could be 1.1440, below which the pair could start a major decline.

USD/JPY Technical Analysis

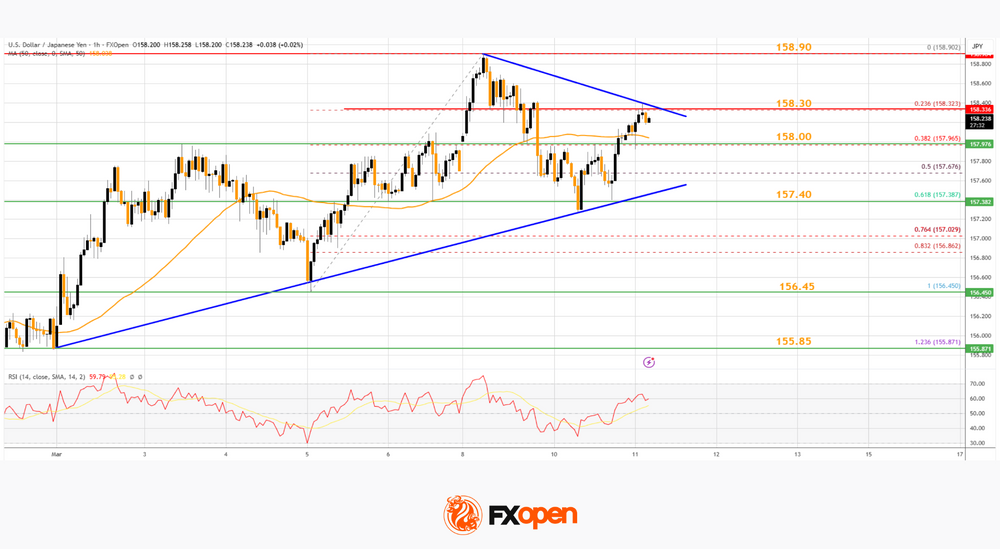
On the hourly chart of USD/JPY at FXOpen, the pair gained pace for a move above 158.00. The US dollar even traded close to 159.00 against the Japanese yen before the bears emerged.

A high was formed at 158.90 before a downside correction. The pair dipped below 158.00 and the 50% Fib retracement level of the upward move from the 156.45 swing low to the 158.90 high. However, the bulls were active above 157.00 and protected the 61.8% Fib retracement.

The pair is back above the 50-hour simple moving average and 158.00. Immediate resistance on the USD/JPY chart is near 158.30. There is also a key contracting triangle at 158.30.

If there is a close above the triangle and the hourly RSI moves above 65, the pair could rise towards 158.90. The next major barrier for the bulls could be 159.25, above which the pair could test 160.00 in the near term.

On the downside, the first major support is near 158.00. The next key region for the bears might be 157.40. If there is a close below 157.40, the pair could decline steadily. In the stated case, the pair might drop towards 156.45. Any more losses might send the pair toward 155.85.

Trade over 50 forex markets 24 hours a day with FXOpen. Take advantage of low commissions, deep liquidity, and spreads from 0.0 pips (additional fees may apply). Open your FXOpen account now or learn more about trading forex with FXOpen.

This article represents the opinion of the Companies operating under the FXOpen brand only. It is not to be construed as an offer, solicitation, or recommendation with respect to products and services provided by the Companies operating under the FXOpen brand, nor is it to be considered financial advice.

Source link

Visited 1 times, 1 visit(s) today

Related Article

US CPI steady at 2.4% in February, core unchanged at 2.5

US CPI steady at 2.4% in February, core unchanged at 2.5

US inflation rose slightly faster than expected in February, though the broader price trend remained stable. Headline CPI increased 0.3% mom, above the expected 0.2% rise, while core CPI—which excludes food and energy—rose 0.2% on the month, matching market expectations. Housing costs continued to play the largest role in the monthly increase. The shelter index

USD/CAD Daily Outlook - ActionForex

USD/CAD Daily Outlook – ActionForex

Daily Pivots: (S1) 1.3547; (P) 1.3575; (R1) 1.3609; More… Intraday bias in USD/CAD is turned neutral first with a temporary low formed at 1.3524. Nevertheless, outlook is unchanged that consolidation pattern from 1.3480 could have completed at 1.3751, after hitting 55 D EMA (now at 1.3704). Risk will stay on the downside as long as

AUD/USD Daily Report - ActionForex

AUD/USD Daily Report – ActionForex

Daily Pivots: (S1) 0.7058; (P) 0.7115; (R1) 0.7177; More… AUD/USD’s rally resumed by breaking through 0.7146 resistance today. Intraday bias is back on the upside for 100% projection of 0.5913 to 0.6706 from 0.6420 at 0.7213. Decisive break there could prompt upside acceleration to 161.8% projection at 0.7703. For now, outlook will remain bullish as

KCM Trade Awarded "Best Forex Trading Platform 2026" by FX Daily Info

KCM Trade Awarded “Best Forex Trading Platform 2026” by FX Daily Info

HONG KONG SAR – Media OutReach Newswire – 11 March 2026 – KCM Trade, a leading global CFD broker, has been honored with the “Best Forex Trading Platform 2026” award at the 2026 Industry Awards hosted by international financial media outlet FX Daily Info in March 2026, underscoring the Group’s brand strength and industry influence

AUD/USD breakout as RBA faces urgency to hike, 0.80 after clearing 0.72?

AUD/USD breakout as RBA faces urgency to hike, 0.80 after clearing 0.72?

Aussie has staged a remarkable breakout today, surging broadly higher to clip a near four-year peak against Dollar. AUD/USD is now knocking on the door of a critical resistance zone at 0.72. Firm break above this level wouldn’t just be a win for the bulls—it would signal strong underlying momentum that could pave the way

WTI Oil Eases Further on Encouraging Signals

WTI Oil Eases Further on Encouraging Signals

WTI oil extends pullback from Monday’s 3 ½ year high ($119.44) on Tuesday, following unexpected and sharp change in the sentiment after President Trump said that war in the Middle East could end soon. He also signaled that the US may lift some sanctions on sales of Russian oil, to partially compensate negative impact from

Gold Price Holds Near Key Support

Gold Price Holds Near Key Support

As the XAU/USD chart shows, the gold price has been holding within the $5,060–$5,200 range over the past several sessions. Bullish view: the key support is the lower boundary of the long-term channel that has been in place since the beginning of 2026. Bearish view: pressure on the price comes from statements by President Trump

EUR/USD Chart Analysis: Pair Rebounds from the Year’s Low

EUR/USD Chart Analysis: Pair Rebounds from the Year’s Low

Analysing the EUR/USD chart five days ago, we: → constructed a downward channel, noting signs that the bears remained in control; → outlined a scenario in which the rate would decline to a new yearly low (and test the lower boundary of the channel). Yesterday’s price action confirmed these assumptions – the low at H

Youtube preview

Forex range trading Gold, gap trading US indices [Video]

Today, we will take a look at Forex Trading on the Dow Jones Industrial Average, EURUSD, AUDUSD and Gold, XAUUSD. Last time we looked at buying the dip on gold, and we did, in fact, get a result. What we have now, however, is a range trading opportunity with price action almost perfectly placed between

Gold at Make-or-Break Support, Bounce Setup Forming?

Gold at Make-or-Break Support, Bounce Setup Forming?

Key Highlights Gold started a fresh decline from $5,420 and traded below $5,200. A major bullish trend line is forming with support at $5,040 on the 4-hour chart. WTI Crude Oil surged toward $120 before there was a sharp correction. USD/JPY extended gains and traded above 158.50. Gold Price Technical Analysis Gold remained well bid

London Session Time In India

London Session Time In India: The Best Forex Trading Session

The London session matters because it is the part of the forex day when liquidity usually rises, spreads often tighten, and major pairs such as EUR/USD and GBP/USD tend to move with more consistency. London also remains the world’s largest foreign exchange center.  In the latest BIS triennial survey, the UK accounted for 38.1% of

D 20260309 Image2

FX Daily Snapshot – MUFG Research

The price of oil has continued to surge higher at the start of this week driven by the ongoing conflict in the Middle East. The price of Brent has hit a fresh high overnight of USD119.50/barrel before dropping back below USD110/barrel. At the worst point it had extended its advance to almost two thirds since

AUD/USD and NZD/USD Struggle as Market Jitters Shake Risk Sentiment

AUD/USD and NZD/USD Struggle as Market Jitters Shake Risk Sentiment

AUD/USD failed to stay in a positive zone and declined below 0.7000. NZD/USD is also moving lower and might extend losses below 0.5850. Important Takeaways for AUD/USD and NZD/USD Analysis Today The Aussie Dollar started a fresh decline from well above 0.7100 against the US Dollar. There is a bearish trend line forming with resistance

Franc Rallies Against Yen in Pot

Franc Rallies Against Yen in Pot

Created on March 09, 2026 The Swiss Franc has risen against the Japanese yen on Friday, as traders will look at this as a major signal. CHF/JPY The Swiss Franc has rallied significantly against the Japanese Yen during the trading session on Friday to threaten the idea of a major breakout yet again. This is

WTI Oil Price Rises Above $100

WTI Oil Price Rises Above $100

Another shocking Monday for the energy market. Last week’s start was remembered for a bullish gap of more than 10% (which was later followed by a pullback), but today’s market open proved even more volatile (as reflected by the ATR indicator). After a bullish gap of roughly 11%, the price continued to climb, reaching a

Quadcode acquires significant stake in FPFX Tech parent Game 7

Quadcode acquires significant stake in FPFX Tech parent Game 7

Game 7, LLC, the parent company of prop trading technology provider FPFX Tech as well as prop white label operator PropAccount, and retail prop firm BullRush, has announced that Quadcode, the fintech group behind IQ Option, Amaiz, and Quadcode AI, has acquired a “significant strategic stake” in the business. The actual size of the investment,

USD/CHF Daily Outlook - ActionForex

USD/CHF Daily Outlook – ActionForex

Daily Pivots: (S1) 0.7781; (P) 0.7810; (R1) 0.7838; More…. Intraday bias in USD/CHF remains neutral for the moment. On the downside, break of 0.7671 support will revive near term bearishness and bring retest of 0.7603 low. Decisive break there will resume larger down trend. On the upside, though, break of 0.7877 will bring stronger rally

0
Would love your thoughts, please comment.x
()
x