EUR/USD Outlook: Euro Pulls Back, Eyes on US Inflation Data


  • The dollar gained momentum ahead of Tuesday’s pivotal inflation report.
  • Forecasts for the US inflation report show that annual inflation will likely come in at 3.8%.
  • ECB’s Fabio Panetta noted on Saturday that the time for rate cuts is fast approaching.

The market painted a bearish picture for Monday’s EUR/USD outlook, with the dollar gaining momentum against the euro in anticipation of Tuesday’s pivotal US inflation report. Moreover, with no major reports on Monday, investors were awaiting Eurozone economic growth data on Wednesday. 

–Are you interested in learning more about copy trading platforms? Check our detailed guide-

The release of the US inflation report will be a major event this week that will shape the outlook for Fed rate cuts. On many occasions, Fed policymakers have said they need more evidence that inflation is falling and will stay near the 2% target. Forecasts for tomorrow’s report show that annual inflation will likely come in at 3.8%.

Notably, the Fed’s Lorie Logan said on Friday that economic reports must show inflation is on a durable decline. Otherwise, she is in no rush to cut interest rates. This was yet another reason for investors to dismiss the possibility of a rate cut in March.

Meanwhile, in the Eurozone, the ECB’s Fabio Panetta noted on Saturday that the time for rate cuts is fast approaching. However, he did not comment on the exact timing. ECB policymakers slowly accept that the next policy move will be a rate cut. However, markets remain uncertain about when this might start. At the moment, there is a possibility that the ECB will implement the first rate cut in April. Still, there is a chance they might delay, following the trend among major central banks.

EUR/USD key events today

There won’t be any high-impact data from the US or the Eurozone. Therefore, the pair will likely drift as investors speculate on the upcoming US inflation report.

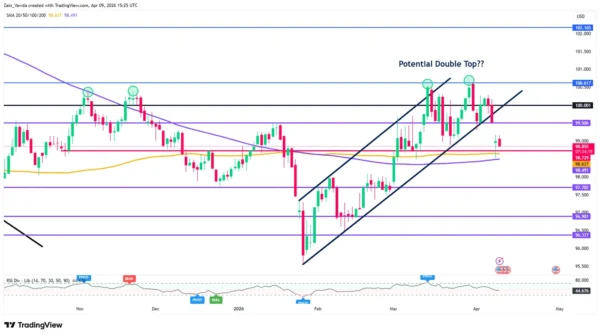
EUR/USD technical outlook: Bears resurface at 1.0800 resistance

EUR/USD technical outlook
EUR/USD 4-hour chart

On the technical side, the EUR/USD price is bouncing lower after retesting the 1.0800 key resistance level. Although the price occasionally chops through the 30-SMA, showing a shallow trend, it keeps making new lows, supporting a strong downtrend.

–Are you interested in learning more about scalping forex brokers? Check our detailed guide-

Recently, the price made a new low by breaking below the 1.0800 support level. Afterwards, it made a corrective move to retest 1.0800 as resistance. Moreover, price action at this level shows that bears were waiting to resume the downtrend. If the price breaks below the 30-SMA, it could make a new low at the 1.0701 support level.

Looking to trade forex now? Invest at eToro!

68% of retail investor accounts lose money when trading CFDs with this provider. You should consider whether you can afford to take the high risk of losing your money


Source link

Visited 1 times, 1 visit(s) today

Related Article

WTI Oil: Bulls Pause Under One-Month High

WTI Oil: Bulls Pause Under One-Month High

WTI oil price edged lower on Monday after hitting new marginally higher high ($115.42) on a partial profit taking from over 13% rally in the previous trading session on Thursday. Traders were cautiously optimistic and awaited more details about potential peace talks between the USA and Iran but remain on high alerts on threats of

TSLA, PLTR and RKLB Forecasts – High Flying Tech Trying to Rebound

Subscribe To Notifications Scan QR code to install app Important DisclaimersFXEmpire is owned and operated by Empire Media Network LTD., Company Registration Number 514641786, registered at 7 Jabotinsky Road, Ramat Gan 5252007, Israel. The content provided on this website includes general news and publications, our personal analysis and opinions, and materials provided by third parties.

Bitcoin and Ethereum: Prolonged Consolidation in Focus

Bitcoin and Ethereum: Prolonged Consolidation in Focus

Market Overview The crypto market capitalisation has recovered to $2.38 trillion, rising by around 2.5% over the past 24 hours — most assets on the watchlist are trading in positive territory. Today’s top performers include Avalanche (+6.6%), Cardano (+5.0%) and Ethereum (+3.8%). Among the few underperformers are IOTA (−1.3%), VeChain (−0.9%) and Bitcoin Cash (−0.6%).

EUR/JPY Daily Outlook - ActionForex

EUR/JPY Daily Outlook – ActionForex

Daily Pivots: (S1) 183.61; (P) 183.95; (R1) 184.24; More… Range trading continues in EUR/JPY and intraday bias remains neutral. On the downside, firm break of 181.85 support should confirm that the correction from 186.86 is already in the third leg. Deeper fall should be seen to 180.78 and below. However, break of 184.75 resistance will

Gold Finds Support at 100-Day SMA Near 4,600

Gold Finds Support at 100-Day SMA Near 4,600

Gold pares losses just below the uptrend line. Momentum signals show easing bearish pressure, but negative bias still holds. Gold is holding steady on Monday, supported by the 100‑day simple moving average (SMA) near 4,670, paring losses after Friday’s pullback triggered by robust US jobs data and renewed escalation in the Iran conflict, which dimmed

Image used for representation purpose only.

Rupee gains 33 paise to 92.85 against U.S. dollar

Image used for representation purpose only. | Photo Credit: Getty Images/iStockphoto The rupee gained 33 paise to 92.85 against the U.S. dollar in early trade on Monday (April 6, 2026), following RBI’s tightened rules to curb speculative positions, capping banks’ net open positions at $100 million, even as global developments continued to act as a

EUR/USD Range Tightens, Is a Breakout Imminent?

EUR/USD Range Tightens, Is a Breakout Imminent?

Key Highlights EUR/USD started a fresh decline after it faced rejection near 1.1625. A major contracting triangle is forming with support at 1.1450 on the 4-hour chart. GBP/USD is moving lower and might struggle to stay above 1.3120. WTI Crude Oil prices show bullish signs above the $105 resistance. EUR/USD Technical Analysis The Euro struggled

OneTwoMarkets Reaches Major Milestone with 400,000 Traders

OneTwoMarkets Reaches Major Milestone with 400,000 Traders

Johannesburg, South Africa, April 05, 2026 (GLOBE NEWSWIRE) — OneTwoMarkets has expanded its analytics capabilities, execution infrastructure and data delivery tools as the platform serves a growing base of over 400,000 traders worldwide. OneTwoMarkets.co.za, headquartered in Johannesburg, South Africa, provides access to live pricing across 45 currency pairs, including popular Asian crosses such as USD/JPY, USD/SGD,

Table of prices Gold 05/04/2026

Weekly Forex Forecast 5th to 10th April 2026 (Charts)

Created on April 05, 2026 The gold market rallied a bit during the course of the trading week as we find ourselves above the $4,600 level again. Friday was of course Good Friday, so we had only a 4-day week, but ultimately this is a situation where traders are looking at this through the prism

AUD/USD Forecast: Oil Shock and NFP Risk Put 0.6835 Support in Focus

Subscribe To Notifications Scan QR code to install app Important DisclaimersFXEmpire is owned and operated by Empire Media Network LTD., Company Registration Number 514641786, registered at 7 Jabotinsky Road, Ramat Gan 5252007, Israel. The content provided on this website includes general news and publications, our personal analysis and opinions, and materials provided by third parties.

USD/CAD Tests Key Resistance Territory After Pullback from Ytd Highs

USD/CAD Tests Key Resistance Territory After Pullback from Ytd Highs

USD/CAD oscillates near the 1.3890-1.3930 resistance zone, tracking three‑month highs. Retraces 61.8% of the pullback from multi‑year highs. RSI and stochastics signal stalled upside momentum. USD/CAD has been oscillating within the 1.3890-1.3930 resistance territory since the beginning of the week, repeatedly testing the upper boundary after a brief break to the three‑month and year-to-date high

US Dollar Forecast: DXY Gains on War Risks Before U.S. Jobs Report

Subscribe To Notifications Scan QR code to install app Important DisclaimersFXEmpire is owned and operated by Empire Media Network LTD., Company Registration Number 514641786, registered at 7 Jabotinsky Road, Ramat Gan 5252007, Israel. The content provided on this website includes general news and publications, our personal analysis and opinions, and materials provided by third parties.

image

NZD/USD Analysis 03/04: Kiwi Tests 0.57 (Video&Chart)

Created on April 03, 2026 The New Zealand dollar crashed into the 0.57 level for the 3rd time this week on Thursday as traders freaked out after the address to the nation that Donald Trump gave. It was odd because he said absolutely nothing new and rates spiked as people started pricing in the end

Dollar Lagging Behind Oil - ActionForex

Dollar Lagging Behind Oil – ActionForex

Politics explains the dollar’s sluggish rise amid rising oil prices. USDJPY bulls have grown immune to verbal intervention. Brent saw a sharp rally amid renewed threats from Donald Trump, but EURUSD stabilised after a decline amid expectations for the US employment report. Bloomberg experts forecast a return to growth in non-farm payrolls in March following

Natural Gas Price Analysis – Natural Gas Continues to Drag Along Bottom

Subscribe To Notifications Scan QR code to install app Important DisclaimersFXEmpire is owned and operated by Empire Media Network LTD., Company Registration Number 514641786, registered at 7 Jabotinsky Road, Ramat Gan 5252007, Israel. The content provided on this website includes general news and publications, our personal analysis and opinions, and materials provided by third parties.

GBP/USD: Geopolitical Tensions Drive Pound Selling

GBP/USD: Geopolitical Tensions Drive Pound Selling

GBP/USD stabilised around 1.3227 on Friday following a sharp decline the previous day. Rising geopolitical tensions have weighed on the pound following fresh statements from US President Donald Trump. Increased military rhetoric towards Iran and the lack of clarity regarding the reopening of the Strait of Hormuz have led to a jump in oil prices

Gold Price Analysis – Gold Continues to See Headline Risks

Subscribe To Notifications Scan QR code to install app Important DisclaimersFXEmpire is owned and operated by Empire Media Network LTD., Company Registration Number 514641786, registered at 7 Jabotinsky Road, Ramat Gan 5252007, Israel. The content provided on this website includes general news and publications, our personal analysis and opinions, and materials provided by third parties.

Silver Weelky Price Analysis – Silver Attempting Recovery

Subscribe To Notifications Scan QR code to install app Important DisclaimersFXEmpire is owned and operated by Empire Media Network LTD., Company Registration Number 514641786, registered at 7 Jabotinsky Road, Ramat Gan 5252007, Israel. The content provided on this website includes general news and publications, our personal analysis and opinions, and materials provided by third parties.

0
Would love your thoughts, please comment.x
()
x