The EUR/USD chart shows the euro rising above its previous February peak of 1.05155, set on the 14th.
On one hand, the euro’s strength is driven by Germany’s national elections over the weekend, where the opposition conservatives, led by Friedrich Merz, secured victory as expected. Investors are now focused on how quickly Merz’s party can form a coalition government to implement much-needed economic reforms.
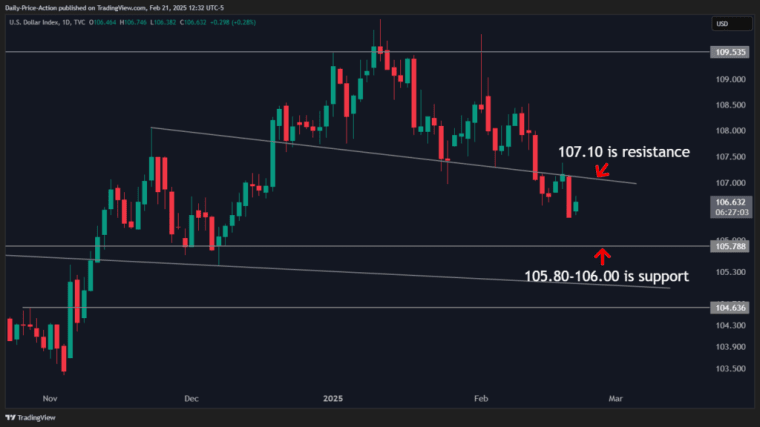
On the other hand, the US dollar index has fallen to its lowest level since mid-December.
According to Reuters, the dollar’s weakness is influenced by:
→ Shifting market perceptions of its value amid Trump’s tariff policies in global trade.
→ Declining US Treasury yields due to expectations of further Fed rate cuts in 2025.
Technical Analysis of EUR/USD Chart
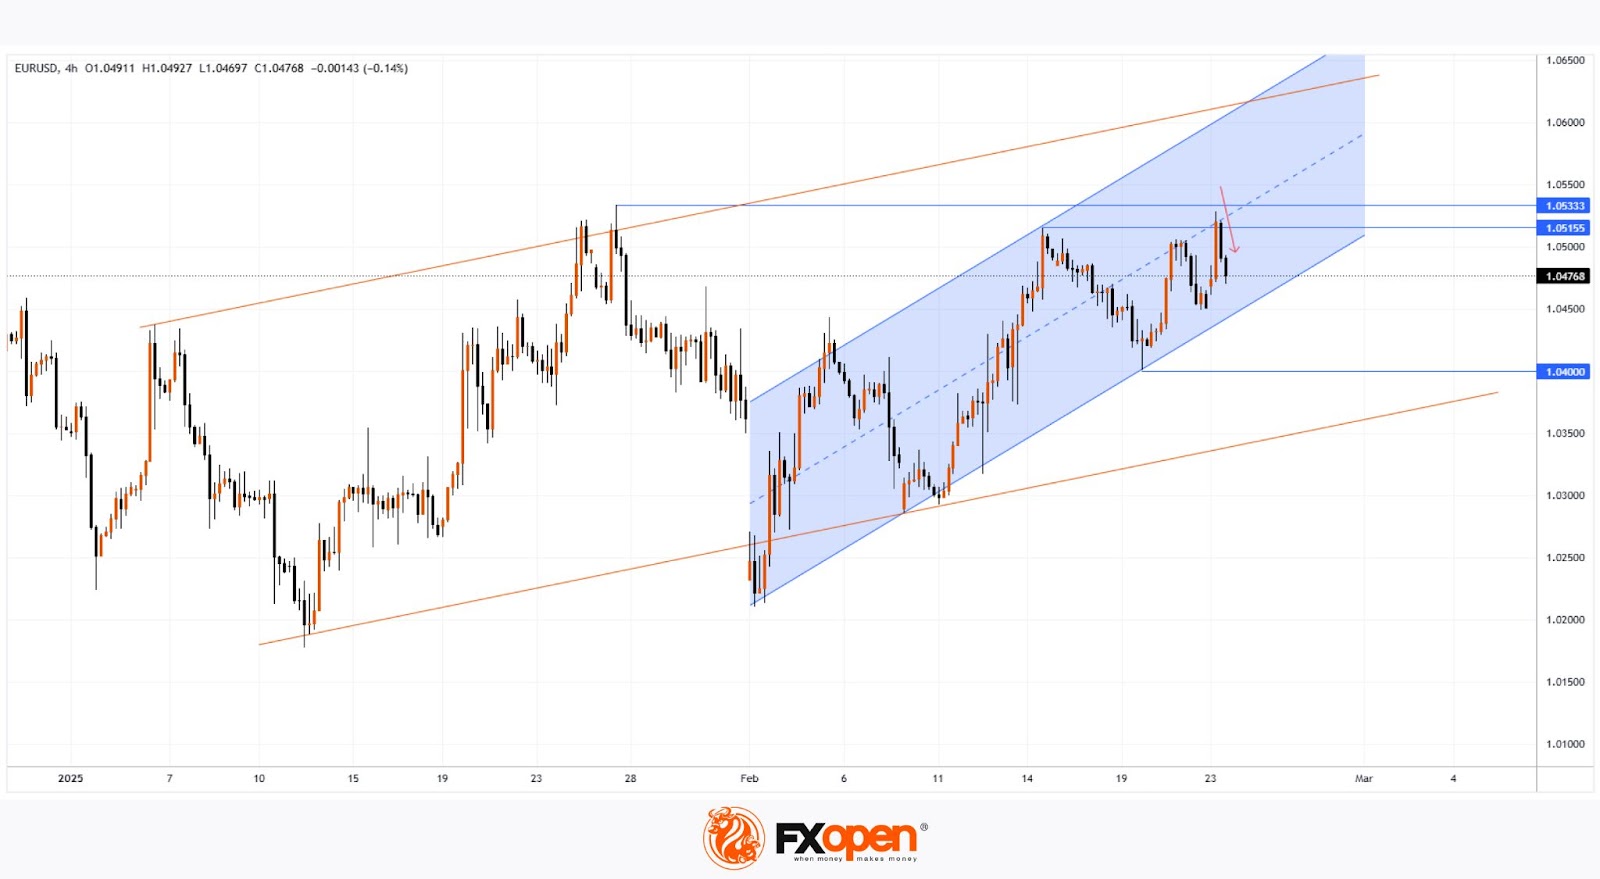
Price movements form an upward channel (marked in blue), but the red arrow highlights bearish activity near resistance levels at:
→ The yearly high around 1.05333.
→ The median line of the channel.
Given the lower liquidity at the start of trading, the initial breakout above the psychological 1.05000 level may have been false. Potential bearish pressure could push EUR/USD towards a support zone, including:
→ The 1.0400 level.
→ The lower boundary of a broader channel (marked in orange).
If bulls intend to maintain their February momentum, signs of buying activity may emerge near the lower boundary of the blue channel.
Trade over 50 forex markets 24 hours a day with FXOpen. Take advantage of low commissions, deep liquidity, and spreads from 0.0 pips. Open your FXOpen account now or learn more about trading forex with FXOpen.
This article represents the opinion of the Companies operating under the FXOpen brand only. It is not to be construed as an offer, solicitation, or recommendation with respect to products and services provided by the Companies operating under the FXOpen brand, nor is it to be considered financial advice.