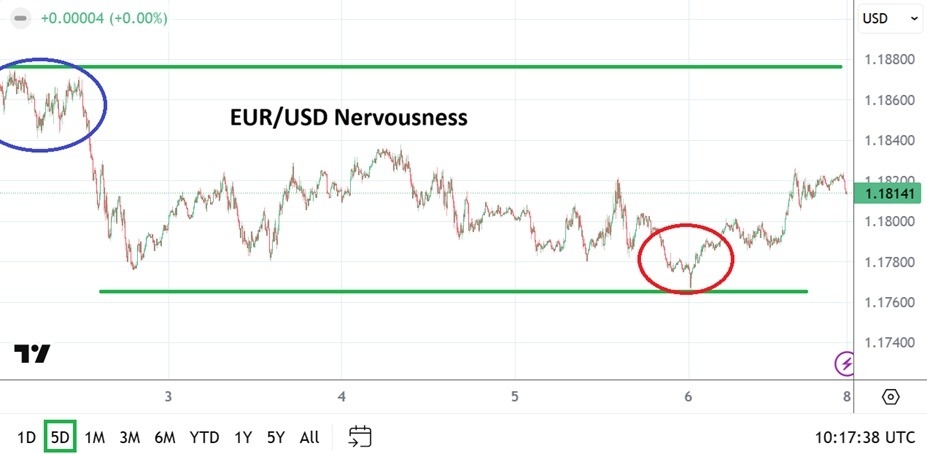
EUR/USD started a decent upward move above 1.1880. USD/JPY declined below 155.00 and is currently consolidating losses.
Important Takeaways for EUR/USD and USD/JPY Analysis Today
- The Euro found support and started a recovery wave above the 1.1850 resistance zone.
- There is a connecting bullish trend line forming with support at 1.1890 on the hourly chart of EUR/USD at FXOpen.
- USD/JPY is trading in a bearish zone below 156.00 and 155.00.
- There is a short-term bearish trend line forming with resistance at 154.65 on the hourly chart at FXOpen.
EUR/USD Technical Analysis
On the hourly chart of EUR/USD at FXOpen, the pair started a fresh increase from 1.1765. The Euro climbed above 1.1800 and 1.1850 against the US Dollar.
The pair even settled above 1.1880 and the 50-hour simple moving average. Finally, it tested the 1.1930 resistance. A high is formed near 1.1928, and the pair is now consolidating gains above the 23.6% Fib retracement level of the upward move from the 1.1765 swing low to the 1.1928 high.
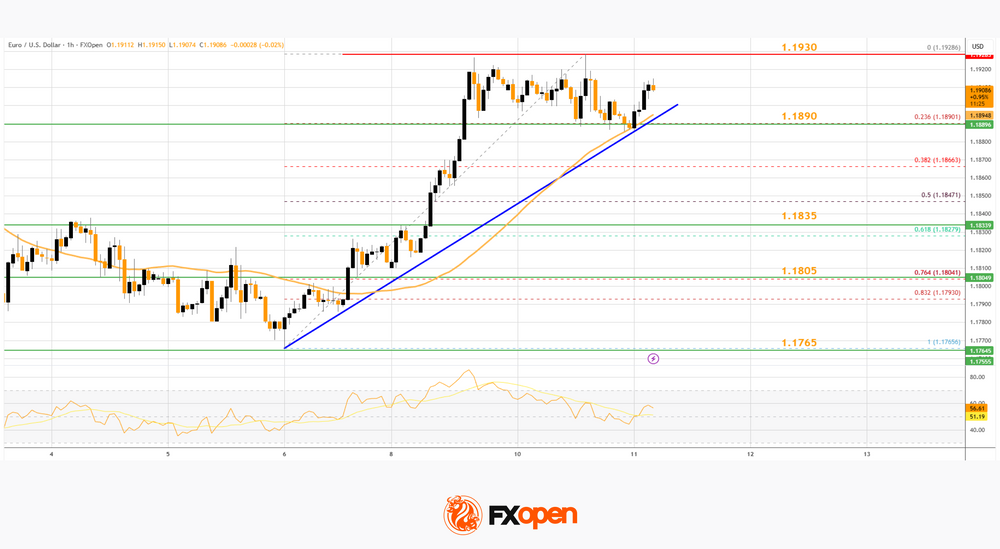
Immediate support is near a connecting bullish trend at 1.1890 and the 50-hour simple moving average. The next area of interest could be 1.1835.
The main breakdown zone on the EUR/USD chart sits near the 76.4% Fib retracement at 1.1805. If there is a downside break below 1.1805, the pair could drop toward 1.1765. Any more losses might send the pair toward the 1.1720 low.
On the upside, the pair is now facing resistance near 1.1930. The next hurdle is 1.1950. An upside break above 1.1950 could set the pace for another increase. In the stated case, the pair might rise toward 1.2000.
USD/JPY Technical Analysis
On the hourly chart of USD/JPY at FXOpen, the pair started a steady decline from well above 157.20. The US Dollar gained bearish momentum below 156.00 against the Japanese Yen.
The pair even settled below 155.00 and the 50-hour simple moving average. There was a spike below 154.50 and the pair traded as low as 153.34. It is now consolidating losses with a bearish angle. Immediate resistance on the USD/JPY chartis near the 23.6% Fib retracement level of the recent decline from the 157.65 swing high to the 153.34 low at 154.35.
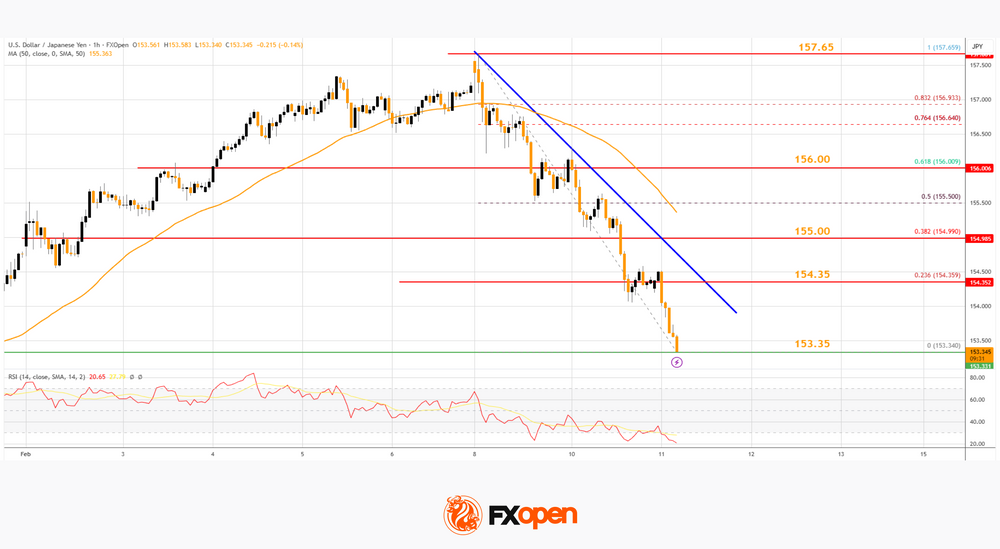
There is also a short-term bearish trend line forming at 154.5. The first barrier for the bulls could be near the 38.2% Fib retracement at 155.00.
If there is a close above the 155.00 level and the hourly RSI moves above 50, the pair could rise toward 156.00. The next key area of interest is near 156.60, above which the pair could test 157.00 in the coming days.
On the downside, the first major support is near 153.35. The next key zone is near 152.50. If there is a close below 152.50, the pair could decline steadily. In the stated case, the pair might drop toward 150.00.
Trade over 50 forex markets 24 hours a day with FXOpen. Take advantage of low commissions, deep liquidity, and spreads from 0.0 pips (additional fees may apply). Open your FXOpen account now or learn more about trading forex with FXOpen.
This article represents the opinion of the Companies operating under the FXOpen brand only. It is not to be construed as an offer, solicitation, or recommendation with respect to products and services provided by the Companies operating under the FXOpen brand, nor is it to be considered financial advice.