Daily Market Price Updates and Commentary 10th November 2026


ICE Futures U.S. Sugar No.11 Contract

Settlement (cUS$/lb) Open High Low Last Volume O/I Life High Life Low
Mar27 18.09 -0.12 â–¼ 18.25 18.29 17.92 18.15 80,618 570,101 21.29 14.42
May27 17.55 -0.11 â–¼ 17.72 17.72 17.36 17.59 37,258 204,062 20.40 14.29
Jul27 17.22 -0.10 â–¼ 17.30 17.34 17.03 17.26 26,305 147,704 19.81 14.27
Oct27 17.24 -0.09 â–¼ 17.37 17.37 17.06 17.28 13,794 96,044 19.63 14.45
Mar28 17.67 -0.08 â–¼ 17.76 17.77 17.49 17.70 4,014 59,481 19.83 14.97
May28 16.74 -0.07 â–¼ 16.81 16.82 16.60 16.75 1,434 26,167 18.77 14.82
Jul28 16.31 -0.06 â–¼ 16.30 16.36 16.16 16.32 934 19,760 18.10 14.74
Oct28 16.33 -0.05 â–¼ 16.30 16.36 16.20 16.34 975 17,555 17.91 15.01
Mar29 16.83 -0.03 â–¼ 16.78 16.84 16.71 16.82 636 6,912 18.19 16.20
May29 16.50 -0.01 â–¼ 16.42 16.50 16.41 16.46 414 2,581 17.74 16.02
Jul29 16.34 0.02 â–² 16.29 16.34 16.29 16.34 98 3,952 17.50 16.15
Oct29 16.40 0.15 â–² 16.22 16.22 16.22 16.22 1 58 16.30 16.22
Total               166,481 1,154,377    

*Volume includes exchange for physicals.


ICE U.S. Sugar No.11 – Spreads

Date Spread Date Spread
Mar27 / May27 0.54 Oct27 / Mar28 -0.43
Mar27 / Jul27 0.87 Oct27 / May28 0.50
Mar27 / Oct27 0.85 Mar28 / May28 0.93
Mar27 / Mar28 0.42 Mar28 / Jul28 1.36
May27 / Jul27 0.33 May28 / Jul28 0.43
May27 / Oct27 0.31 May28 / Oct28 0.41
Jul27 / Oct27 -0.02 Jul28 / Oct28 -0.02
Jul27 / Mar28 -0.45 Jul28 / Mar29 -0.52


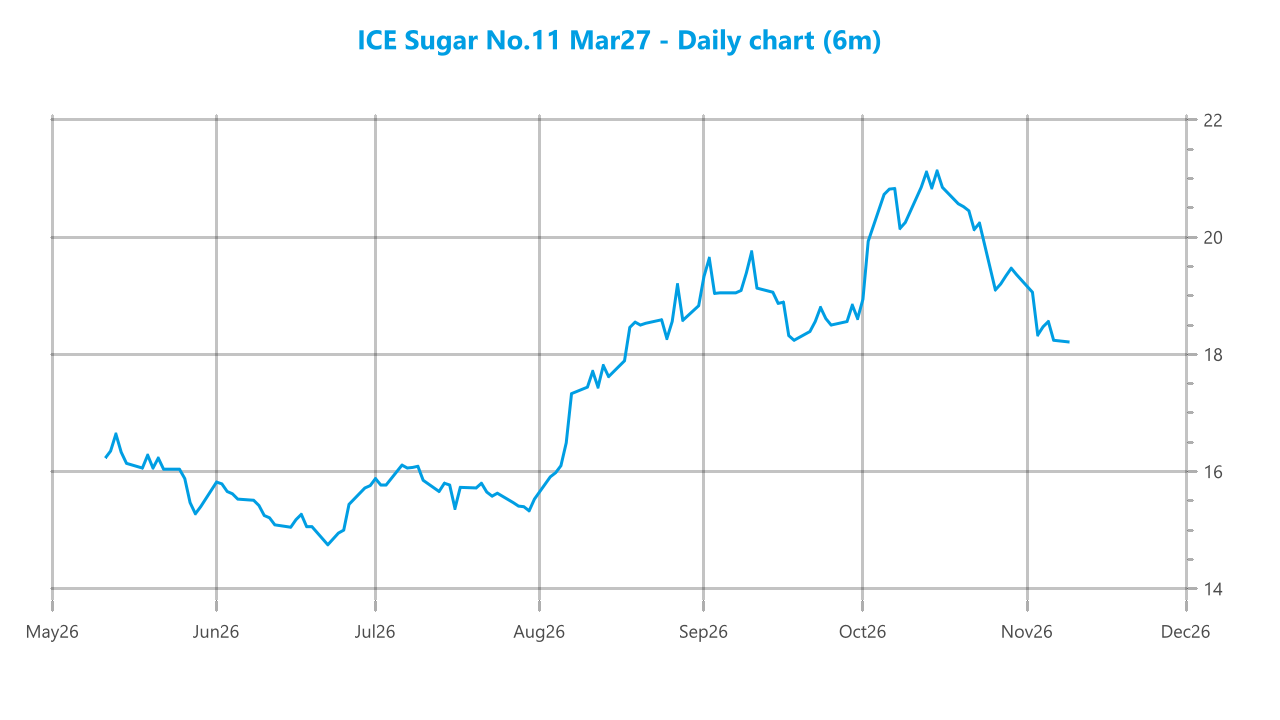
Despite starting with token gains the market immediately turned south to 18.10, bringing instant focus to the 18.02 support level. Smaller traders seized on the opportunity to test the support and within an hour we had slipped to 18.05, though the 18c area remained tantilisingly out of reach due to some solid scale buying. Short covering returned March’27 through the middle of the morning and placed the market at a small credit as the US Day approached. Selling then followed from here too and sent prices back through the range, this time encouraging some heavier long liquidation which sent values beneath 18c for the first time since August. Buying did not go away, and the presence of the scales meant that we traded no lower than 17.91 before some shorts threw in the towel and covered back exposures. This brought the price back to the teens, but with little appetite to add to long positions the market then continued to flirt with 18c across the rest of the afternoon. By the close we continued to hold above this market and a settlement at 18.09 was recorded to leave the chart still vulnerable should physical interest not pick up. 


ICE Europe White Sugar Futures Contract

Settlement (US$/mt) Open High Low Last Volume O/I Life High Life Low
Dec26 505.10 -4.50 â–¼ 509.80 511.00 502.40 505.90 8,416 12,024 567.70 393.20
Mar27 512.40 -4.90 â–¼ 516.40 518.60 510.60 513.30 13,877 69,871 577.40 398.00
May27 514.10 -4.20 â–¼ 517.70 519.20 511.90 514.90 6,530 31,055 581.80 401.40
Aug27 510.10 -2.30 â–¼ 512.00 513.20 507.20 510.90 3,530 18,005 574.30 404.30
Oct27 505.10 -1.60 â–¼ 506.40 507.50 501.90 505.50 1,295 8,923 565.30 408.20
Dec27 502.40 -1.00 â–¼ 503.20 504.40 499.40 502.30 342 4,153 558.20 414.30
Mar28 501.70 0.00   501.70 503.50 499.00 501.40 106 913 552.60 421.00
May28 495.60 0.50 â–² 495.30 498.10 493.10 493.10 13 893 542.80 426.30
Aug28 487.40 0.60 â–² 488.60 489.50 483.70 485.00 12 628 529.90 431.10
Oct28 480.60 0.20 â–² 478.00 481.80 478.00 481.50 15 78 520.00 441.70
Dec28 478.60 1.00 â–² 483.00 484.10 483.00 484.10 5 11 518.10 468.60
Mar29 480.00 -33.80 â–¼ 517.10 517.10 517.10 517.10 1 8 517.10 483.20
May29 477.10 -0.60 â–¼ 474.20 475.60 474.20 475.60 3 7 517.50 473.60
Aug29 474.10 —   — — — — — — — —
Total               34,145 146,569    

*Volume includes exchange for physicals.


ICE Europe White Sugar – Spreads

Date Spread Date Spread
Dec26 / Mar27 -7.30 Mar27 / May27 -1.70
Dec26 / May27 -9.00 May27 / Aug27 4.00
Dec26 / Aug27 -5.00 Aug27 / Oct27 5.00
Dec26 / Oct27 0.00 Oct27 / Dec27 2.70


White Sugar Premium

Date Premium Date Premium
Mar27 / Mar27 113.58 Jul28 / Aug28 127.83
May27 / May27 127.19 Oct28 / Oct28 120.59
Jul27 / Aug27 130.46 Mar29 / Mar29 108.96
Oct27 / Oct27 125.02 May29 / May29 113.34
Mar28 / Mar28 112.14 Jul29 / Aug29 113.87
May28 / May28 126.55    

*Values calculated basis 6:10 PM.


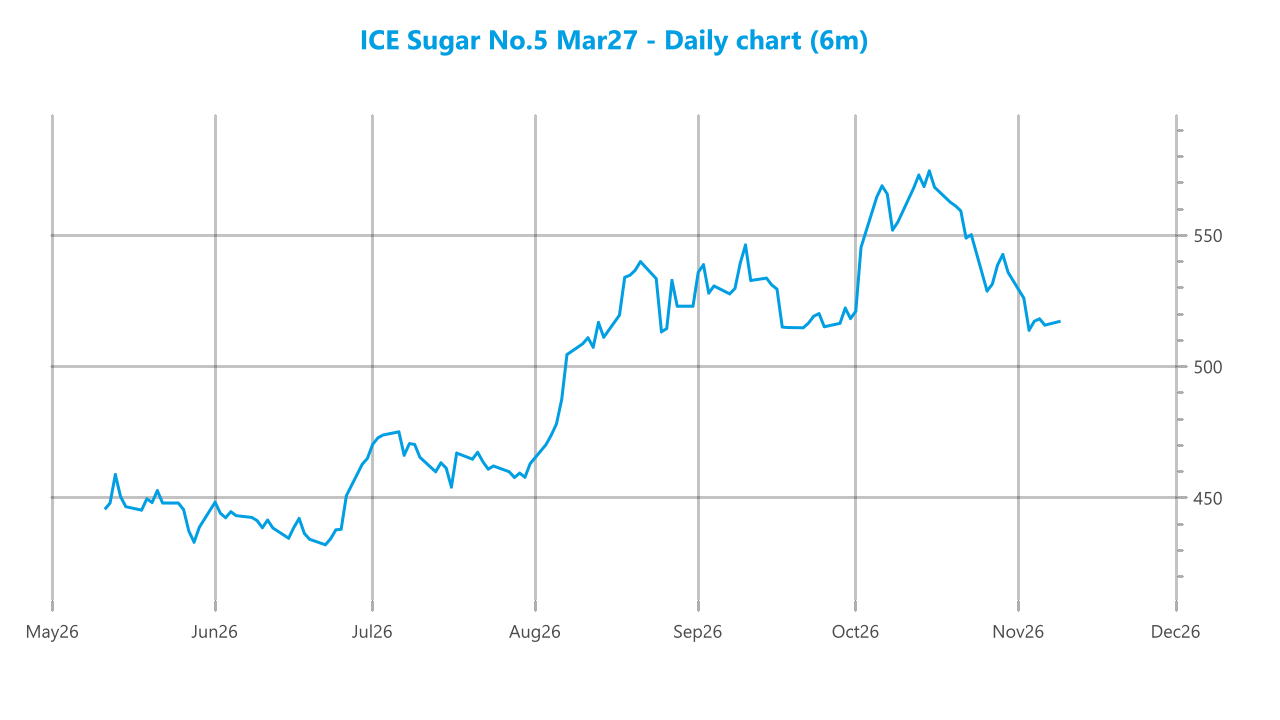
March’27 quickly dropped on the opening in reaction to lower No.11 values and place values back in the lower teens. Firmer white premium values driven by the strengthening of Dec’26 spreads were meaning that the recent lows were not being troubled and following a short period of consolidation the March’27 contract climbed back through the teens to sit at a small credit for the remainder of the morning. Through noon the picture changed again, and on this occasion the selling had a bigger impact as we first returned to the early lows before being pressured down to test last Fridays $509.70 low. Better buying ahead of this mark allowed March’27 to hold on, and having reached $510.60 there was another bounce driven by more day trader covering. Alongside we saw the Dec’26 enjoy a steady, but calmer day with the Dec’26/March’27 ranging between -$8.50 and -$6.00 on still decent volume, with the value sitting little changed into the final part of the session. By now the flat price had returned to the lower end of the range, but there was no heavy pressure applied and the earlier lows remained intact. A mixed close resulted in a settlement level at $512.40 leaving the wider picture unchanged for another day.   


Market chart asset


Market chart asset


A man with short brown hair and glasses, wearing a light striped shirt, is smiling and looking slightly to the left in an indoor setting. Other people are blurred in the background.

Jon Whybrow

Jon joined CZ in 1991, working in the Treasury department before moving to join the derivatives team in 1994. Over 30 years Jon has built up significant experience across derivatives markets and products, particularly sugar, and is now Head of Flow derivatives providing market execution services for CZ’s global client base. He is responsible for the market commentaries which are published each day on CZ app.


More from this author

Source link

Visited 1 times, 1 visit(s) today

Related Article

Jim Cramer’s Top 5 Dividend Stocks for Safe, Consistent Returns

From 2000 through 2009, dividends earned S&P 500 investors an annualized 1.8%, according to Hartford Funds. Even with those payments, the index posted a negative total return for the decade. Over the longer stretch from 1940 through 2025, Hartford found that dividend income accounted for an average of 33% of the index’s total return. For

If the stock market crashes, history says this FTSE 100 share could be a smart buy!

Image source: Getty Images Stock market tension’s growing, with AI stocks slumping as worries over a new tech bubble increase. Yet the FTSE 100 continues its march towards new record highs — as I type, it’s up roughly 2% over the past trading week. Yet this isn’t the time for investors to get complacent. If

Why the S&P 500 Could Be Heading for a Repeat of 2018

If the S&P 500 (^GSPC +1.63%) is able to stay above a 10% gain for the year, it’ll be the fourth consecutive year that it has been able to produce above-average returns. It’s a rare feat. But it’s not common for a reason, as sooner or later, there’s inevitably a pullback. The last time the

Costco (COST) Declares $30 Special Dividend And Reauthorizes $4 Billion Buyback

Costco Wholesale (NasdaqGS:COST) declared a special cash dividend of $30 per share on common stock. The retailer also reauthorized a $4b share repurchase program with an expiration date in January 2030. The one time $30 special dividend and long dated buyback plan matter, but they are only part of the Costco picture. Our analysis turns

The Stock Market Is Repeating a Pattern Not Seen in Decades, but History Says Investors Who Make This 1 Move Will Win Out

The stock market has been in a rough patch lately, with major market indexes stumbling hard last week. The S&P 500(SNPINDEX:^GSPC), Dow Jones Industrial Average(DJINDICES:^DJI), and Nasdaq Composite (NASDAQINDEX:^IXIC)all fell sharply from their recent all-time highs, with the Nasdaq plunging into correction territory. Missed Nvidia in 2009? This Rare Signal Is Flashing Again. In 2009,

Markets fluctuate as US rate worries temper tech bounce

After last week’s rout, fuelled by fears that Democrats would ramp up regulation of artificial intelligence, beaten-down tech stocks have bounced this week on bargain-buying and a feeling that their fears may have been overdone. ADVERTISEMENT ADVERTISEMENT Sentiment was also given a boost by earnings from data centre operator CoreWeave, which said sales would come

Warren Buffett’s Successor, Greg Abel, Just Bought $9.6 Billion of the Oracle of Omaha’s Favorite Stock (No, Not Alphabet!)

Few events garner more attention on Wall Street than Berkshire Hathaway‘s (NYSE:BRKA)(NYSE:BRKB) earnings reports. This is especially true now that Warren Buffett has retired and his successor, Greg Abel, is overseeing the company’s day-to-day operations and its closely watched $359 billion investment portfolio. While the September-ended quarter was more or less business as usual for

1 Reliable ETF I’m Buying Forever, Even if the Stock Market Crashes

Investors have no doubt been feeling mixed emotions lately. On one hand, all three major U.S. stock market indexes — the S&P 500 (^GSPC -0.38%), Nasdaq Composite, and Dow Jones — are all up for the year. On the other hand, many are worried about a potential crash due to AI bubble fears, stretched valuations,

Major US Companies Say No to New Tokenized Stock Platform

Over 60 major US-listed companies have formally shut the door on having tokenized versions of their shares traded on OKXICE, a collaborative platform built by crypto exchange OKX and Intercontinental Exchange (NYSE:ICE), owner of the New York Stock Exchange. The platform promised around-the-clock access to digital tokens designed to track the value of 63 US

Meet the 1 Stock I’d Buy With $500, Even If the Market Fell 5% Tomorrow

Buying a stock and watching it drop 5% the next day, or watching the broader market drop the next day, is a grim way to start an investment. Last week made this situation and question less hypothetical. On Thursday of last week, the S&P 500 fell 4.4%, its worst day since April 2025. The Nasdaq

Graco Enters $600 Million Accelerated Share Repurchase Agreement

Market Closed – 04:00:03 2026-11-10 pm EST 5-day change 1st Jan Change 69.70 USD -0.17% +0.78% -14.97% Published on 11/10/2026 at 05:32 pm EST MT Newswires This article is reserved for our members. Log in to continue Log inCreate an account Nov. 10 Graco Enters $600 Million Accelerated Share Repurchase Agreement MT Nov. 09 Graco

Tech sell-off sees investors pivot to defensive sectors

Traders work on the floor of the New York Stock Exchange, Sept. 16, 2026. Jeenah Moon | Reuters Markets are in a “state of alert,” according to analysts monitoring a pivot from riskier tech sector bets into defensive stocks. Technology stocks — a key driver of rallies in recent years — have been notably volatile

TSMC’s Board Approves NT$9 Per Share Q3 Dividend; Shares Up 3%

End-of-day quote 2026-11-10 5-day change 1st Jan Change 2,285.00 TWD +2.24% -0.44% +47.42% Published on 11/10/2026 at 10:11 pm EST MT Newswires This article is reserved for our members. Log in to continue Log inCreate an account DurationAuto.2 months3 months6 months9 months1 year2 years5 years10 yearsMax. PeriodDayWeek Taiwan Semiconductor Manufacturing Co Ltd is a Taiwan-based

Why Sandisk Stock Dropped Again on Tuesday

Sandisk (SNDK -2.99%) stock sank 5.4% through 1:05 p.m. ET Tuesday on some discouraging news about the computer memory market — and this time it has nothing to do with waning artificial intelligence demand, increased data center regulation — or worries about Jensen Huang’s personal life, either. Instead, this new worry is about Sandisk specifically.

Buy the Dip: 5 Stocks Insiders Are Loading Up On After the Recent Market Sell-Off

Thursday, November 5 represented the worst trading session for the U.S. market in over a year. the Nasdaq Composite dropped 5.52%, the S&P 500 fell 4.36%, and the Dow shed 3.44%, as Wall Street’s post-midterm optimism could not last long. Concerns around a potential weakness in AI spending reversed the post-election rally and led to

Why Did Aletheia Downgrade Nvidia (NVDA)?

We just published a list of the 10 Stocks Analysts Just Downgraded and Nvidia (NASDAQ:NVDA) ranked 10th on this list. Wall Street has had a rough start to November. The Nasdaq Composite fell 5.52% on November 5, its steepest one-day drop in 19 months, and slid into a correction, more than 10% below its October

Prediction: Nov. 18 Will Be a Huge Day for the Stock Market

Over the weekend, three Republican leaders of Congress announced that they are requesting a closed-door briefing with Nvidia (NVDA -5.47%) CEO Jensen Huang on Nov. 18. The request follows reports concerning Huang’s relationship with a business executive suspected of providing information to Chinese intelligence. For investors, the central issue isn’t Huang’s personal life. It’s whether

0
Would love your thoughts, please comment.x
()
x