- China’s February power battery installations dropped 24.6% year-on-year to 26.3 GWh, impacted by the timing of the Chinese New Year holiday.
- Despite the slump in installations, total battery production and export volumes continued to show year-on-year growth.
China monthly power battery installations
2024
2025
2026
China’s power battery installations suffered a significant decline in February as a major holiday disrupted industrial production.
Power battery installations stood at 26.3 GWh in February, down 24.64% year-on-year and 37.4% from January, data from the China Automotive Battery Innovation Alliance (CABIA) showed Thursday.
The drop was largely attributed to the impact of the 2026 Chinese New Year holiday. The break, which fell between February 15 and February 23 this year, dealt a direct blow to industrial output.
In contrast, last year’s holiday occurred from January 28 to February 4, creating a base effect discrepancy for the year-on-year data.
Lithium iron phosphate (LFP) batteries continued to dominate the market. Their installations reached 20.6 GWh in February, accounting for 78.3% of the total.
However, the volume represented a 27.5% decrease year-on-year and a 36.9% drop from January.
By comparison, installations of ternary lithium batteries stood at 5.7 GWh in February, making up 21.7% of the total.
Ternary battery installations fell 11.4% year-on-year and 39.1% month-on-month.
China monthly power battery installations: Ternary vs LFP
LFP
Ternary
| Month | Ternary (GWh) | LFP (GWh) |
|---|---|---|
| Jan 2020 | 1.6 | 0.7 |
| Feb 2020 | 0.5 | 0.1 |
| Mar 2020 | 2.2 | 0.5 |
| Apr 2020 | 2.6 | 0.9 |
| May 2020 | 2.7 | 0.8 |
| Jun 2020 | 3.0 | 1.7 |
| Jul 2020 | 3.3 | 1.7 |
| Aug 2020 | 3.5 | 1.6 |
| Sep 2020 | 4.2 | 2.3 |
| Oct 2020 | 3.4 | 2.4 |
| Nov 2020 | 5.9 | 4.7 |
| Dec 2020 | 6.0 | 6.9 |
| Jan 2021 | 5.4 | 3.3 |
| Feb 2021 | 3.3 | 2.2 |
| Mar 2021 | 5.1 | 3.9 |
| Apr 2021 | 5.2 | 3.2 |
| May 2021 | 5.2 | 4.5 |
| Jun 2021 | 5.9 | 5.1 |
| Jul 2021 | 5.5 | 5.8 |
| Aug 2021 | 5.3 | 7.2 |
| Sep 2021 | 6.1 | 9.5 |
| Oct 2021 | 7.0 | 8.4 |
| Nov 2021 | 9.2 | 11.6 |
| Dec 2021 | 11.1 | 15.1 |
| Jan 2022 | 7.3 | 8.9 |
| Feb 2022 | 5.8 | 7.8 |
| Mar 2022 | 8.2 | 13.2 |
| Apr 2022 | 4.4 | 8.9 |
| May 2022 | 8.3 | 10.2 |
| Jun 2022 | 11.6 | 15.4 |
| Jul 2022 | 9.8 | 14.3 |
| Aug 2022 | 10.5 | 17.2 |
| Sep 2022 | 11.2 | 20.4 |
| Oct 2022 | 10.8 | 19.7 |
| Nov 2022 | 11.0 | 23.1 |
| Dec 2022 | 11.4 | 24.7 |
| Jan 2023 | 5.4 | 10.7 |
| Feb 2023 | 6.7 | 15.2 |
| Mar 2023 | 8.7 | 19.0 |
| Apr 2023 | 8.0 | 17.1 |
| May 2023 | 9.0 | 19.2 |
| Jun 2023 | 10.1 | 22.7 |
| Jul 2023 | 10.6 | 21.7 |
| Aug 2023 | 10.8 | 24.1 |
| Sep 2023 | 12.2 | 24.2 |
| Oct 2023 | 12.3 | 26.8 |
| Nov 2023 | 15.7 | 29.1 |
| Dec 2023 | 16.6 | 31.3 |
| Jan 2024 | 12.6 | 19.7 |
| Feb 2024 | 6.9 | 11.0 |
| Mar 2024 | 11.3 | 23.6 |
| Apr 2024 | 9.9 | 25.5 |
| May 2024 | 10.4 | 29.5 |
| Jun 2024 | 11.1 | 31.7 |
| Jul 2024 | 11.4 | 30.1 |
| Aug 2024 | 12.1 | 35.0 |
| Sep 2024 | 13.1 | 41.3 |
| Oct 2024 | 12.2 | 47.0 |
| Nov 2024 | 13.6 | 53.6 |
| Dec 2024 | 14.3 | 61.0 |
| Jan 2025 | 8.5 | 30.2 |
| Feb 2025 | 6.4 | 28.4 |
| Mar 2025 | 10.0 | 46.6 |
| Apr 2025 | 9.3 | 44.8 |
| May 2025 | 10.5 | 46.5 |
| Jun 2025 | 10.7 | 47.4 |
| Jul 2025 | 10.9 | 44.9 |
| Aug 2025 | 10.9 | 51.6 |
| Sep 2025 | 13.8 | 62.2 |
| Oct 2025 | 16.5 | 67.5 |
| Nov 2025 | 18.2 | 75.3 |
| Dec 2025 | 18.2 | 79.8 |
| Jan 2026 | 9.4 | 32.7 |
| Feb 2026 | 5.7 | 20.6 |
Despite the decline in installations, battery production activity remained robust.
China’s combined output of power and energy storage batteries totaled 141.6 GWh in February, achieving a 41.3% year-on-year increase, though it was down 15.7% from January.
China monthly battery production
| Month | 2024 | 2025 | 2026 |
|---|---|---|---|
| Jan | 65.2 | 107.8 | 168 |
| Feb | 43.6 | 100.3 | 141.6 |
| Mar | 75.8 | 118.3 | |
| Apr | 78.2 | 118.2 | |
| May | 82.7 | 123.5 | |
| Jun | 84.5 | 129.2 | |
| Jul | 91.8 | 133.8 | |
| Aug | 101.3 | 139.6 | |
| Sept | 111.3 | 151.2 | |
| Oct | 113.1 | 170.6 | |
| Nov | 117.8 | 176.3 | |
| Dec | 124.5 | 201.7 |
The production of LFP batteries reached 114.6 GWh in February, up 41.7% year-on-year but down 16.1% from the previous month.
Ternary battery output was 26.9 GWh in February, rising 39.7% year-on-year but falling 13.8% from January.
China monthly battery production: Ternary vs LFP
LFP
Ternary
| Month | Ternary (GWh) | LFP (GWh) |
|---|---|---|
| Jan 2020 | 0.37 | 0.46 |
| Feb 2020 | 0.50 | 0.40 |
| Mar 2020 | 3.20 | 1.20 |
| Apr 2020 | 2.90 | 1.80 |
| May 2020 | 3.10 | 2.10 |
| Jun 2020 | 3.10 | 2.20 |
| Jul 2020 | 3.30 | 2.80 |
| Aug 2020 | 4.40 | 3.00 |
| Sep 2020 | 4.80 | 3.80 |
| Oct 2020 | 5.50 | 4.30 |
| Nov 2020 | 7.30 | 5.40 |
| Dec 2020 | 8.50 | 6.50 |
| Jan 2021 | 6.80 | 5.20 |
| Feb 2021 | 5.10 | 4.30 |
| Mar 2021 | 5.80 | 5.40 |
| Apr 2021 | 6.70 | 6.20 |
| May 2021 | 5.00 | 8.80 |
| Jun 2021 | 7.40 | 7.80 |
| Jul 2021 | 8.00 | 9.30 |
| Aug 2021 | 8.40 | 11.10 |
| Sep 2021 | 9.60 | 13.50 |
| Oct 2021 | 9.20 | 15.90 |
| Nov 2021 | 10.40 | 17.80 |
| Dec 2021 | 11.40 | 20.10 |
| Jan 2022 | 10.80 | 18.80 |
| Feb 2022 | 11.60 | 20.10 |
| Mar 2022 | 15.60 | 23.60 |
| Apr 2022 | 10.30 | 18.60 |
| May 2022 | 16.30 | 19.20 |
| Jun 2022 | 18.30 | 22.90 |
| Jul 2022 | 16.60 | 30.60 |
| Aug 2022 | 19.30 | 30.80 |
| Sep 2022 | 24.30 | 34.80 |
| Oct 2022 | 24.20 | 38.60 |
| Nov 2022 | 24.20 | 39.10 |
| Dec 2022 | 18.50 | 33.90 |
| Jan 2023 | 12.42 | 26.38 |
| Feb 2023 | 14.57 | 30.49 |
| Mar 2023 | 18.20 | 32.90 |
| Apr 2023 | 17.60 | 29.30 |
| May 2023 | 18.60 | 37.80 |
| Jun 2023 | 17.70 | 42.20 |
| Jul 2023 | 20.40 | 40.50 |
| Aug 2023 | 23.13 | 50.30 |
| Sep 2023 | 25.30 | 51.90 |
| Oct 2023 | 23.60 | 53.60 |
| Nov 2023 | 27.80 | 59.80 |
| Dec 2023 | 25.00 | 52.50 |
| Jan 2024 | 22.70 | 42.40 |
| Feb 2024 | 14.80 | 28.60 |
| Mar 2024 | 24.20 | 51.40 |
| Apr 2024 | 22.70 | 55.40 |
| May 2024 | 22.00 | 60.50 |
| Jun 2024 | 20.50 | 63.80 |
| Jul 2024 | 23.00 | 68.50 |
| Aug 2024 | 24.80 | 76.30 |
| Sep 2024 | 27.00 | 84.20 |
| Oct 2024 | 23.50 | 89.50 |
| Nov 2024 | 24.20 | 93.40 |
| Dec 2024 | 26.00 | 98.10 |
| Jan 2025 | 20.70 | 87.00 |
| Feb 2025 | 19.30 | 80.90 |
| Mar 2025 | 23.80 | 94.30 |
| Apr 2025 | 23.50 | 94.60 |
| May 2025 | 27.20 | 96.10 |
| Jun 2025 | 29.50 | 99.50 |
| Jul 2025 | 29.50 | 104.10 |
| Aug 2025 | 30.90 | 108.60 |
| Sep 2025 | 31.50 | 119.40 |
| Oct 2025 | 33.70 | 136.70 |
| Nov 2025 | 36.40 | 139.60 |
| Dec 2025 | 40.60 | 160.50 |
| Jan 2026 | 31.30 | 136.70 |
| Feb 2026 | 26.90 | 114.60 |
On the export front, China shipped a combined 23.9 GWh of power and energy storage batteries in February. This reflected a 13.2% year-on-year growth, though it edged down 0.9% from January.
China monthly power battery exports
2024
2025
2026
Detail export data showed a mixed performance. Power battery exports stood at 16.9 GWh in February, surging 31.9% year-on-year but decreasing 4.6% from January.
China monthly battery exports: Ternary vs LFP
LFP
Ternary
| Month | Ternary (GWh) | LFP (GWh) |
|---|---|---|
| Jan 2023 | 5.4 | 2.6 |
| Feb 2023 | 6.6 | 2.8 |
| Mar 2023 | 6.8 | 2.0 |
| Apr 2023 | 6.5 | 2.3 |
| May 2023 | 7.6 | 3.7 |
| Jun 2023 | 6.6 | 3.3 |
| Jul 2023 | 7.2 | 3.9 |
| Aug 2023 | 6.8 | 3.7 |
| Sep 2023 | 8.3 | 2.5 |
| Oct 2023 | 7.4 | 4.0 |
| Nov 2023 | 8.2 | 4.7 |
| Dec 2023 | 9.6 | 4.3 |
| Jan 2024 | 3.9 | 4.2 |
| Feb 2024 | 4.7 | 3.3 |
| Mar 2024 | 6.1 | 5.6 |
| Apr 2024 | 6.3 | 2.6 |
| May 2024 | 6.3 | 3.4 |
| Jun 2024 | 8.3 | 4.8 |
| Jul 2024 | 5.9 | 3.5 |
| Aug 2024 | 7.7 | 3.3 |
| Sep 2024 | 8.2 | 3.4 |
| Oct 2024 | 7.3 | 3.4 |
| Nov 2024 | 8.5 | 3.9 |
| Dec 2024 | 7.7 | 5.0 |
| Jan 2025 | 6.8 | 4.3 |
| Feb 2025 | 7.5 | 5.3 |
| Mar 2025 | 8.8 | 5.0 |
| Apr 2025 | 8.7 | 5.6 |
| May 2025 | 7.2 | 6.2 |
| Jun 2025 | 9.0 | 6.8 |
| Jul 2025 | 8.4 | 6.2 |
| Aug 2025 | 8.7 | 6.3 |
| Sep 2025 | 10.7 | 6.8 |
| Oct 2025 | 11.5 | 7.9 |
| Nov 2025 | 11.7 | 9.4 |
| Dec 2025 | 9.2 | 9.8 |
| Jan 2026 | 9.7 | 8.0 |
| Feb 2026 | 9.2 | 7.6 |
On the other hand, energy storage battery exports were 7.0 GWh in February, down 15.5% year-on-year but up 9.3% from the previous month.
For context, China’s power battery installations showed a different trend in January. Installations that month reached 42.0 GWh, realizing an 8.4% year-on-year increase.
At that time, LFP battery installations were 32.7 GWh, accounting for 77.7% of the total. Power battery exports in January stood at 17.7 GWh, up 59.3% year-on-year.
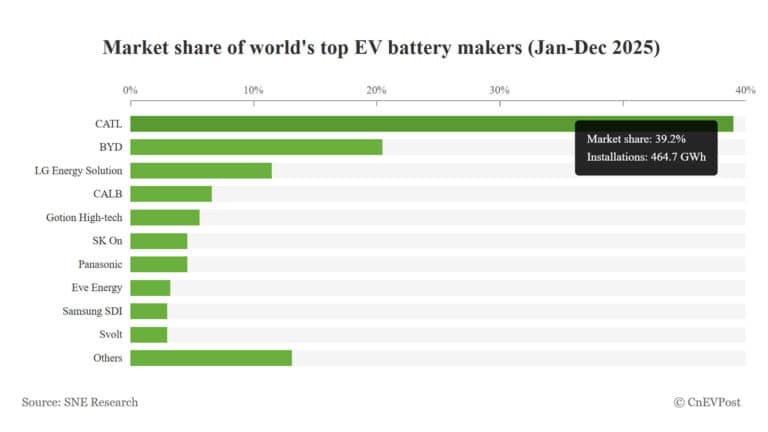
CATL and BYD’s combined EV battery installations in 2025 came in at 659.5 GWh, accounting for 55.6% of the global total.