Key takeaways
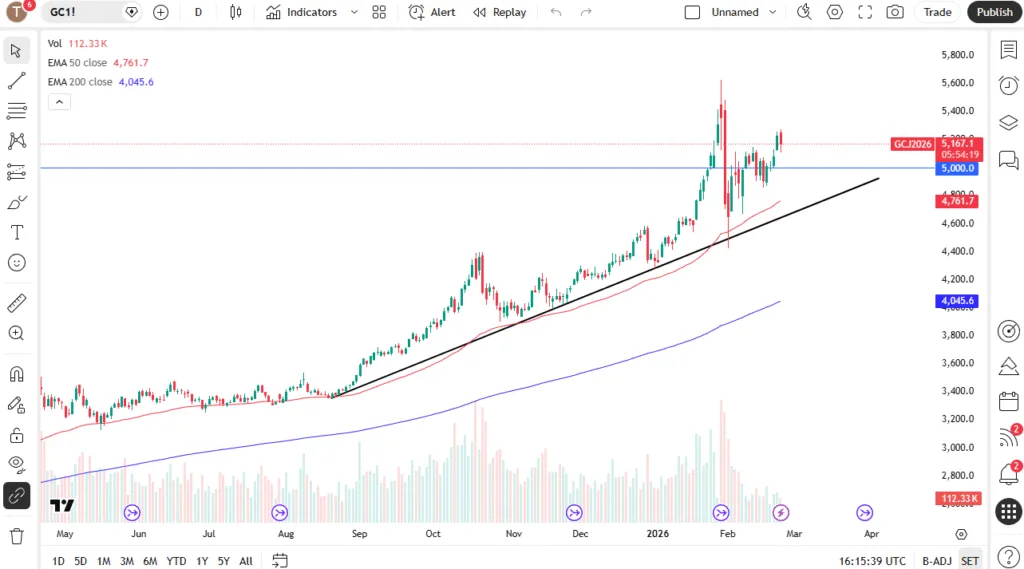
- Corrective rebound gaining traction: Gold has broken above $5,170 and extended its bounce from the $4,402 low, with price action evolving within a minor ascending channel and maintaining a bullish bias above $5,046 support.
- Falling real yields supportive: The US 10-year real yield has declined sharply from 1.98% to 1.72%, reducing the opportunity cost of holding non-yielding gold and reinforcing the rebound narrative.
- Upside levels in focus: While momentum remains constructive, a sustained move above $5,307/$5,320 opens room toward $5,448. A break below $5,046 would jeopardize the recovery and expose deeper supports near $4,960–$4,703.
Gold (XAU/USD) cleared above a key short-term resistance level at $5,170 (also close to the 61.8% Fibonacci retracement of the waterfall decline from 29 January 2026 all-time high to 2 February 2026 low). It printed an intraday high of $5,250 on Tuesday, 24 February 2026.
Short-term technical elements and intermarket analysis suggest the ongoing corrective rebound phase from the 2 February 2026 low of $4,402 is likely still has room to extend further to the upside.
Lower opportunity cost of holding Gold
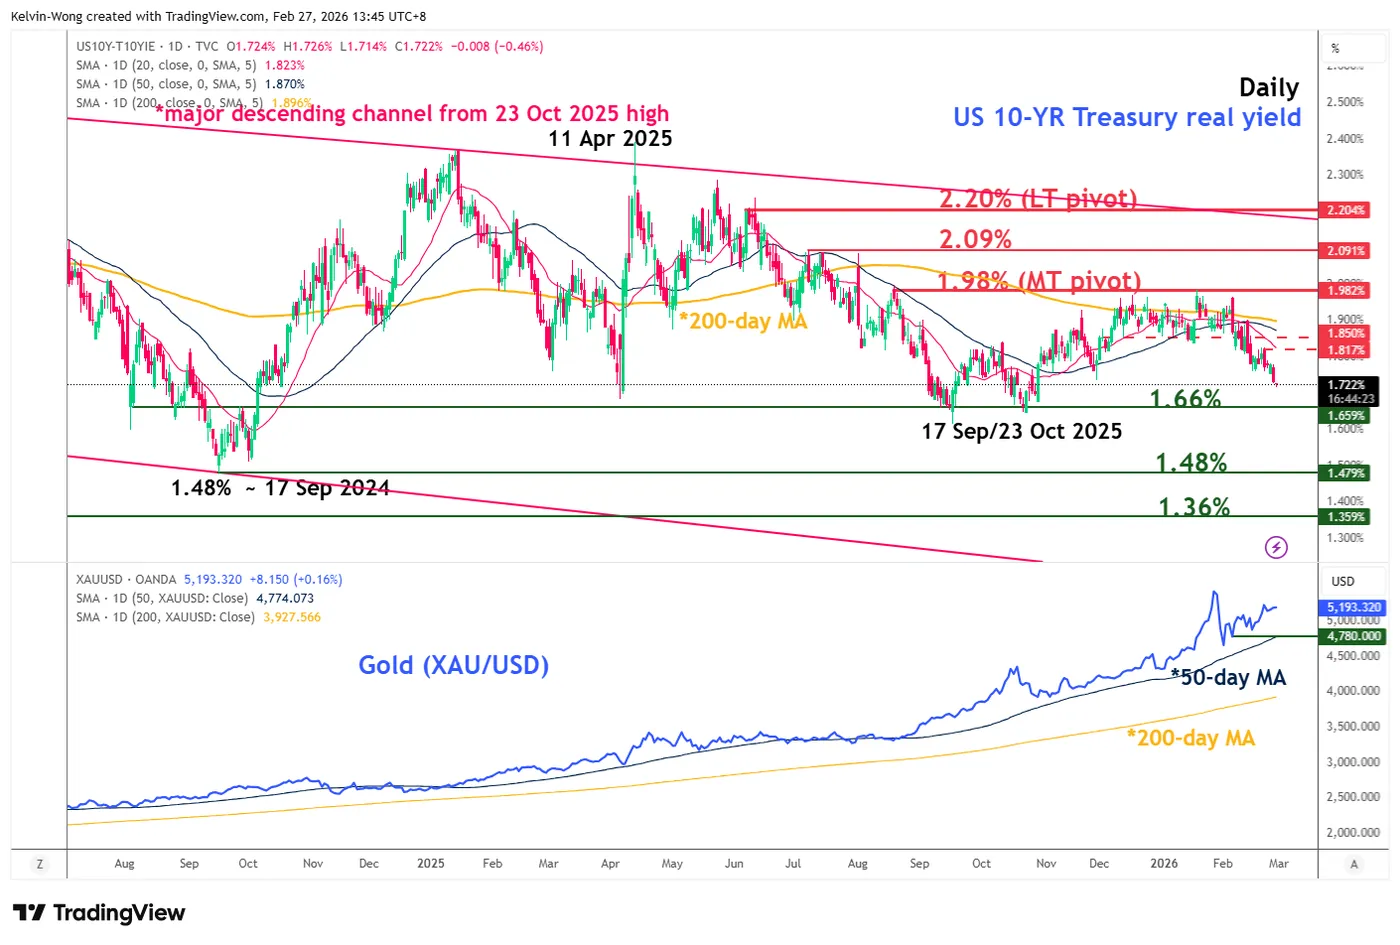
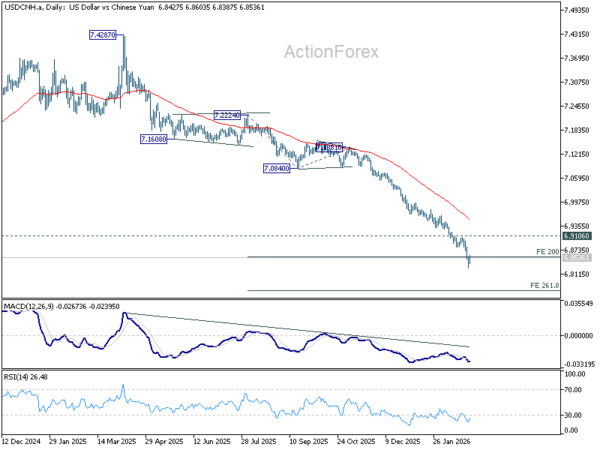
Fig. 1: US 10-year Treasury real yield medium-term trend as of 27 Feb 2026 (Source: TradingView)
The 10-year US Treasury real yield (after subtracting 10-year US inflation expectations from the 10-year US Treasury breakeven rate, which is then subtracted from the nominal yield) has staged a bearish reaction from its key medium-term pivotal resistance of 1.98% (see Fig. 1).
It has fallen by 24 basis points (bps) from 5 February 2026 to a current intraday level of 1.72% as of Friday, 27 February 2026, at the time of writing.
Price actions have reintegrated below its 20-day and 50-day moving averages, which suggests further potential weakness for the 10-year US Treasury real yield to retest the 17 September/23 October 2025 swing low area at 1.66%.
Hence, via the lens of intermarket analysis, a further drop in the 10-year US Treasury real yield lowers the opportunity cost of holding Gold (a non-interest income-bearing asset), in turn supporting the ongoing rebound seen in Gold (XAU/USD).
Let’s now focus on the short-term trajectory (1 to 3 days) for Gold (XAU/USD)
Gold (XAU/USD) – Evolving within a minor ascending channel
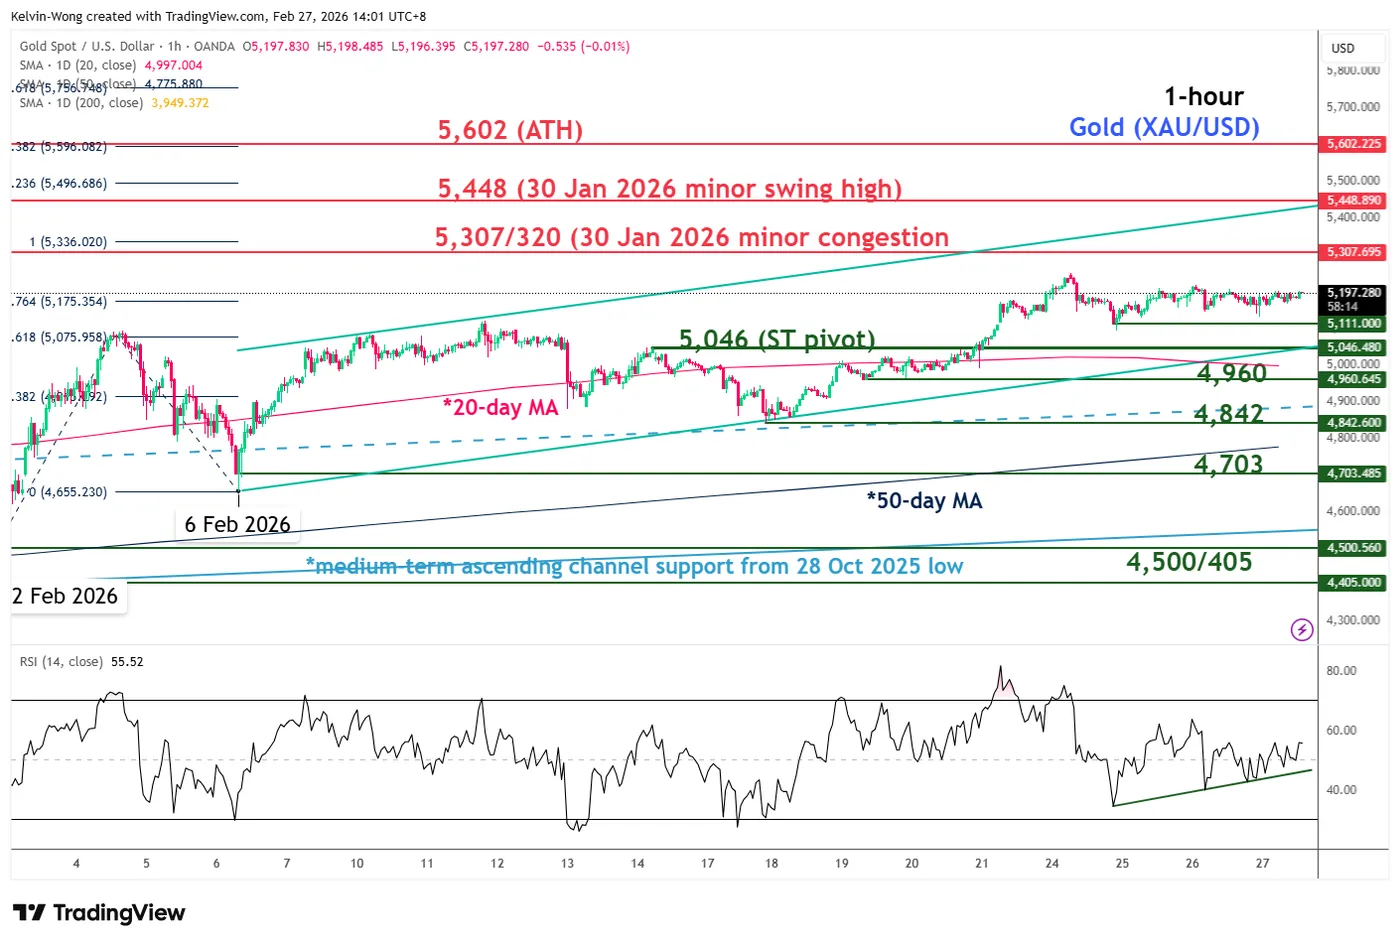
Fig. 2: Gold (XAU/USD) as of 27 Feb 2026 (Source: TradingView)
Bullish bias above $5,046 key short-term pivotal support (also the 20-day moving average with next intermediate resistances coming in at $5,307/320 (also a Fibonacci extension) and $5,448 (see Fig. 2).
On the flip side, a break and an hourly close below $5,046 put the minor corrective rebound phase (running from 2 February 2026 low) in jeopardy to expose the next intermediate supports at $4,960, $4,842, and $4,703.
Key elements to support the bullish bias on Gold (XAU/USD)
- Its price actions have started to oscillate within a minor ascending channel since 6 February 2025, with its upper and lower boundaries at around $5,448 and $5,046, respectively.
- Its hourly RSI momentum indicator has been supported by an ascending trendline since 24 February 2026 and just pushed above the 50 level. These observations suggest a potential build-up of short-term bullish momentum.