Chart Alert: EUR/USD Found Support Above 1.1495, Potential Push Up Towards “Expanding Wedge” Range Resistance

  • USD strength fading within range: Post-FOMC USD strength lacks follow-through, with the US Dollar Index nearing key resistance (100.10–100.54), suggesting limited upside and potential near-term exhaustion.
  • Hawkish ECB supporting EUR: Rising inflation risks (linked to the US-Iran conflict and energy shock) have pushed the European Central Bank toward a more hawkish stance, narrowing US–Eurozone yield spreads and underpinning a potential EUR/USD rebound.
  • EUR/USD at key technical inflection: Pair is holding above 1.1495 support; a break above 1.1573 could drive a rebound toward 1.1635–1.1673, while a drop below 1.1495 would resume the broader downtrend toward 1.1455–1.1400.

The initial pop-up in US dollar strength following the FOMC meeting last Wednesday, 18 March 2026, does not have a clear positive follow-through, as the US Dollar Index remains trapped within a complex medium-term sideways range configuration that has been in place since 29 May 2025.

The recent 3-day rally in the US Dollar Index, which began on Tuesday, 24 March 2026, has almost reached the medium-term range resistance zone of 100.10/100.54, where minor short-term US dollar strength may be dissipated at this juncture (see Fig. 1).

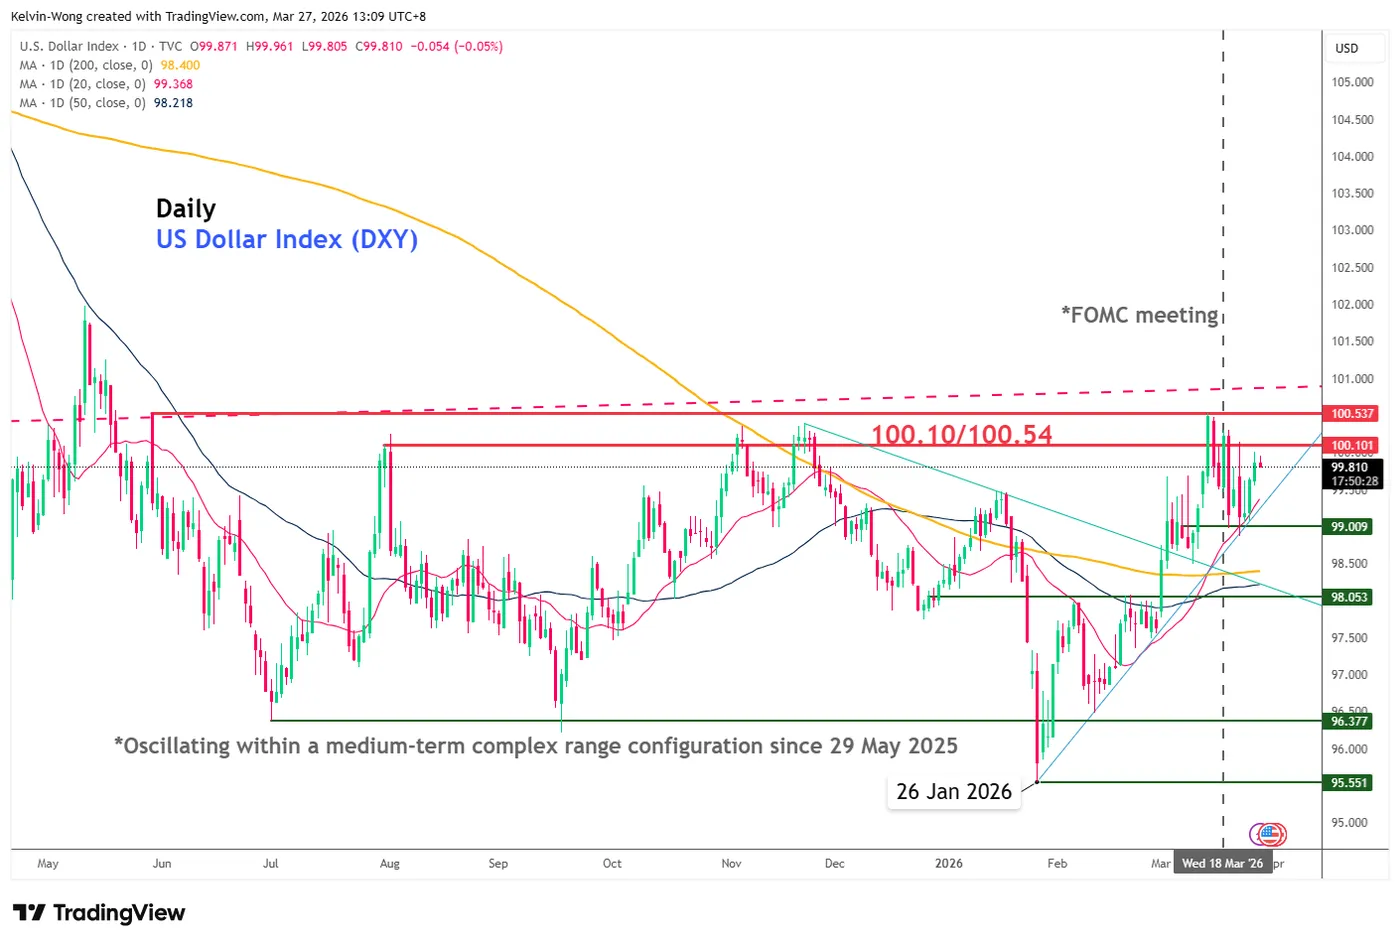
Fig. 1: US Dollar Index medium-term trend as of 27 Mar 2026 (Source: TradingView)

Hawkish ECB ‘saves’ the euro for now

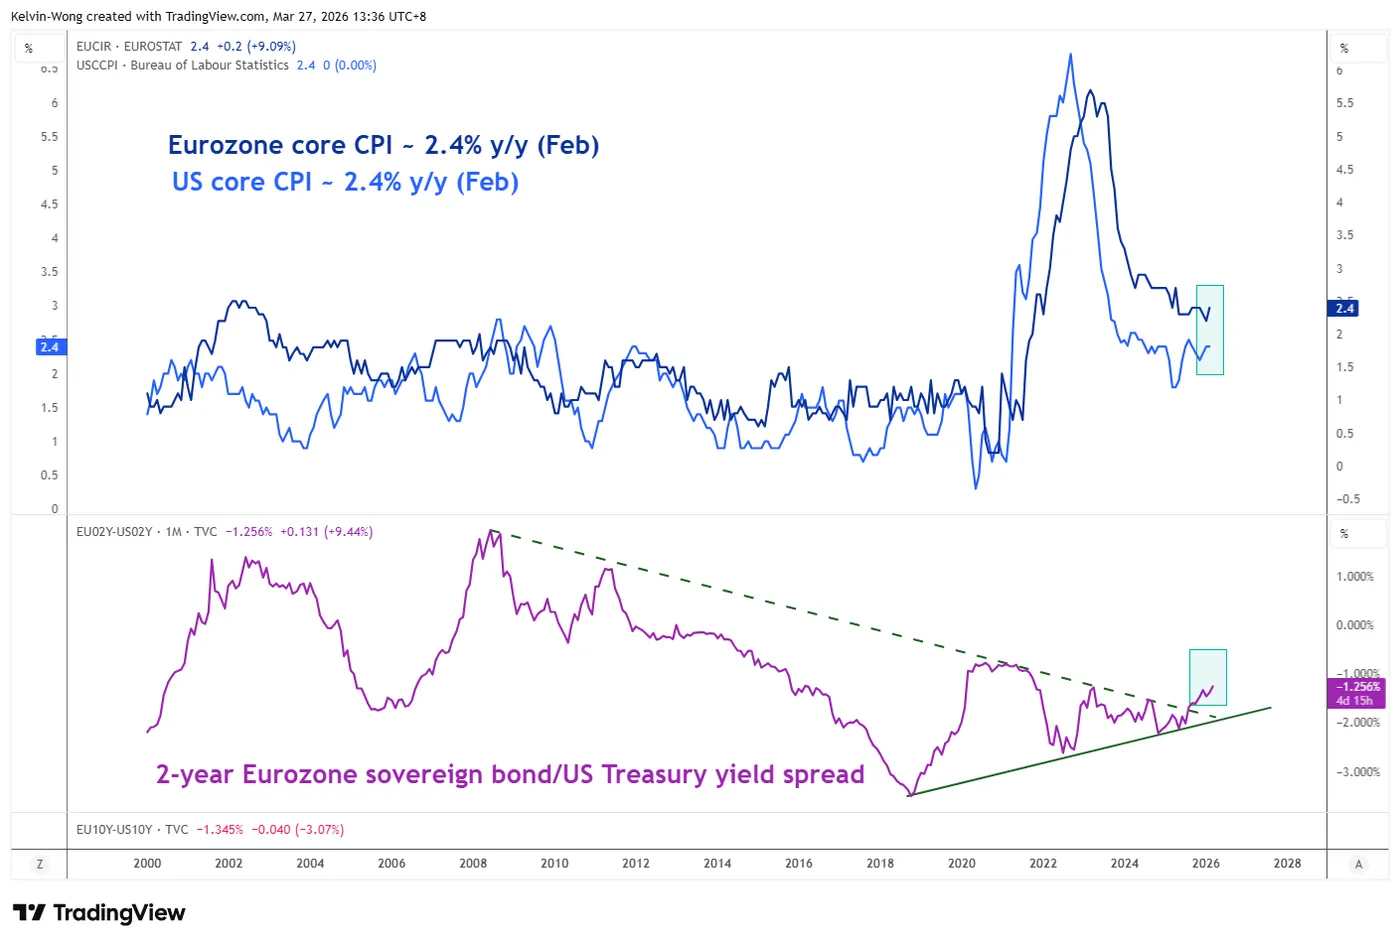
Fig. 2: Narrowing of 2-year yield discount spread between Eurozone sovereign bond and US Treasury note as of 27 Mar 2026 (Source: TradingView)

A hawkish stance or guidance from the US Federal Reserve does not necessarily result in sustained US dollar strength, as the currency’s trajectory is ultimately shaped by relative monetary policy dynamics across other major developed market central banks.

The European Central Bank (ECB) has voiced concerns of stagflation risk arising from the ongoing US-Iran war that led to the closure of the Strait of Hormuz, reducing global oil and energy flows significantly.

Even though, in the ECB’s last monetary policy meeting on 19 March 2026, where it left its key policy deposit rate unchanged at 2% since June 2025, it has issued a hawkish guidance where the ECB prioritized heightened inflation risk over demand destruction that led to the Eurozone’s interest rate swaps market to price in at least two interest rate hikes by ECB before 2026 ends.

In a slew of public speeches made this week so far, key ECB officials have maintained their stances of combating inflation as a primary initiative over demand growth concerns arising from a potential prolonged global oil and energy supply shock.

ECB President Lagarde said the ECB will act decisively and swiftly if the current surge in energy costs risks a broader bout of inflation.

ECB Governing Council member Nagel added that the ECB may start to hike interest rates at its next monetary policy meeting in April if the inflation outlook continues to accelerate due to the US-Iran war.

The European Central Bank’s increasingly hawkish stance has driven a further narrowing of the 2-year yield discount differential between Eurozone sovereign bonds and US Treasuries (see Fig. 2).

The 2-year yield spread of the Eurozone sovereign bond over the US Treasury note has inched higher since its major bullish breakout in September 2025, from -1.6% to -1.26% at this time of writing.

A further narrowing of the 2-year sovereign bond yield discount between the Eurozone and the US is likely to support at least a minor recovery in the EUR/USD.

Let’s focus now on the short-term trajectory (1 to 3 days) of the EUR/USD from a technical analysis perspective.

EUR/USD – 3-day decline stalling at “Expanding Wedge” support

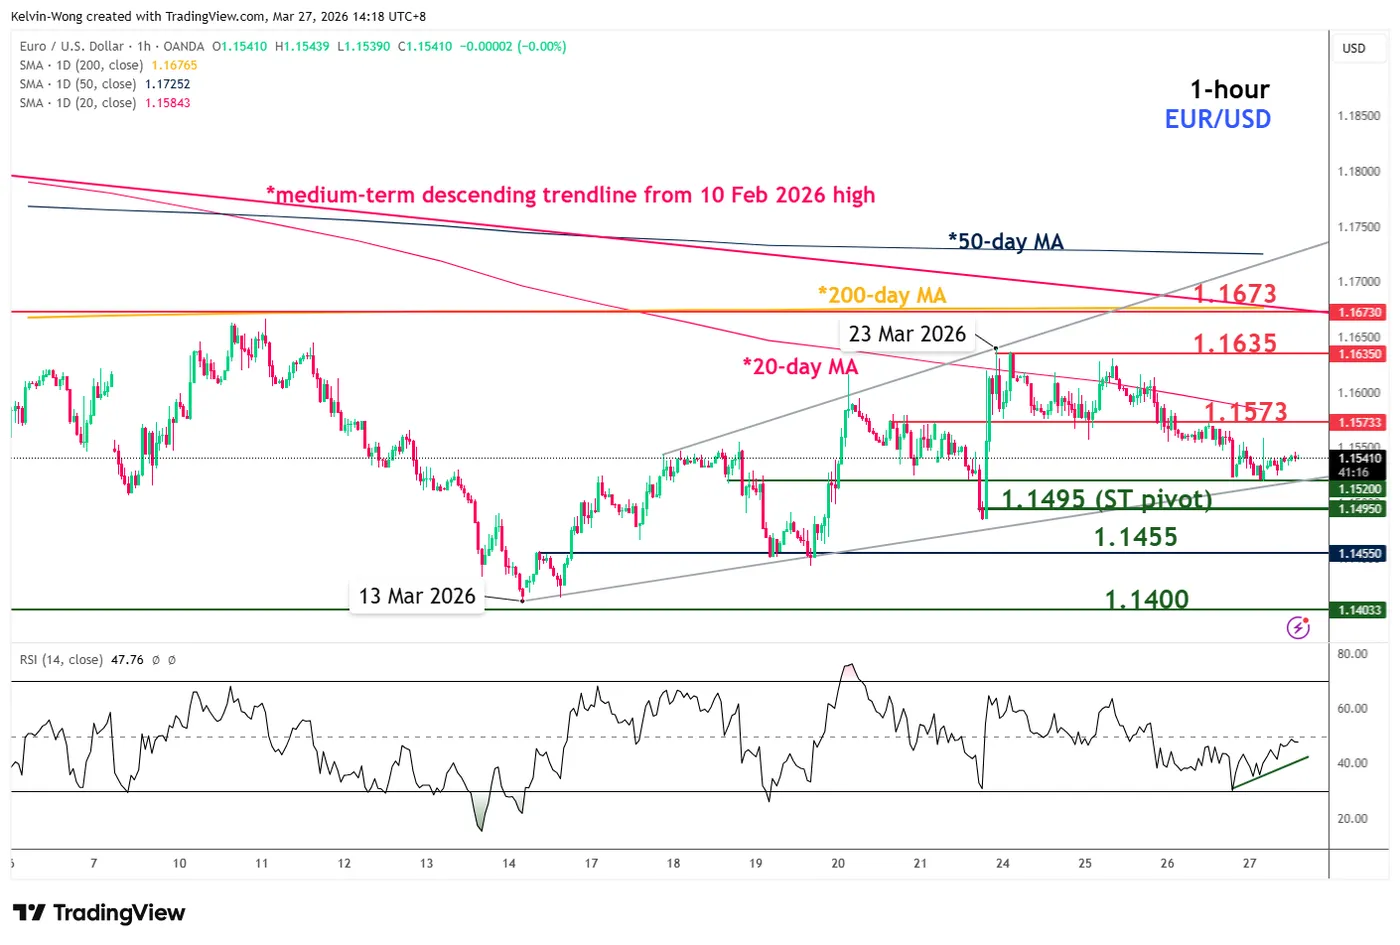
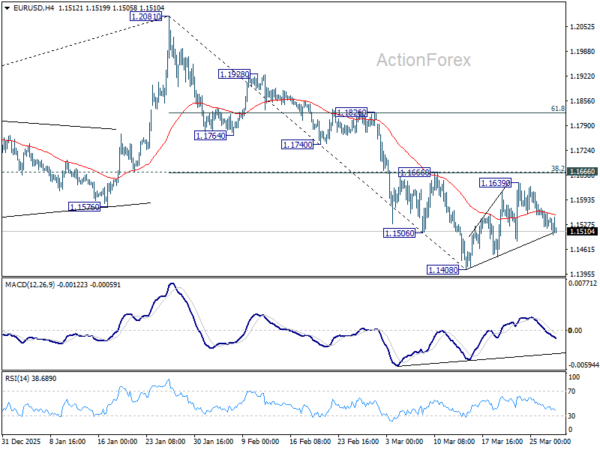
Fig. 3: EUR/USD minor trend as of 27 Mar 2026 (Source: TradingView)

The recent 3-day decline of 1% seen in the EUR/USD from the Monday, 23 March 2026 minor swing high of 1.1640 has started to stall at the minor “Expanding Wedge” support on Thursday, 26 March 2026.

Watch the 1.1495 key short-term pivotal support on the EUR/USD, breaking above 1.1573 near-term resistance (also the 20-day moving average) may unleash a further corrective push up towards the upper limit of the minor “Expanding Wedge” configuration, with the next intermediate resistances coming in at 1.1635 and 1.1673 (also the key 200-day moving average) (see Fig. 3).

On the other hand, a break with an hourly close below 1.1495 invalidates the corrective rebound scenario for the multi-month bearish impulsive down move sequence to resume, exposing the next intermediate supports at 1.1455 and 1.1400 in the first step.

Key elements to support the bullish bias on EUR/USD

  • The recent 3-day decline has stalled at the minor “Expanding Wedge” support in place since the 13 March 2026 minor swing low.
  • The hourly RSI momentum indicator has traced out a bullish divergence condition near its oversold region.

Source link

Visited 1 times, 1 visit(s) today

Related Article

AUD/USD Daily Report - ActionForex

AUD/USD Daily Report – ActionForex

Daily Pivots: (S1) 0.6853; (P) 0.6907; (R1) 0.6941; More… Intraday bias in AUD/USD on the downside as this point. Fall from 0.7187 is seen as correcting the whole up trend from 0.5913. Deeper decline would be seen to 38.2% retracement of 0.5913 to 0.7187 at 0.6700. On the upside, though, above 0.6956 minor resistance will

EUR/AUD Daily Outlook - ActionForex

EUR/AUD Daily Outlook – ActionForex

Daily Pivots: (S1) 1.6651; (P) 1.6706; (R1) 1.6796; More… EUR/AUD’s rise from 1.6125 short term bottom continues today and intraday bias remains on the upside. Sustained break of 55 D EMA (now at 1.6755) will pave the way to 38.2% retracement of 1.8554 to 1.6125 at 1.7053. Nevertheless, below 1.6607 minor support will turn intraday

Trading app scams surge 1,400%: Millions of US investors at risk as trading interest soars, expert warns

Trading app scams surge 1,400%: Millions of US investors at risk as trading interest soars, expert warns

Beware of fakes and impersonations Scammers often create fake versions of popular trading platforms to trick users into sharing their personal information. With AI, these clones can be extremely convincing, replicating layouts, logos and even fake testimonials. Hence, always check the URLs carefully since scammers often use slightly altered domain names to catch careless users out.  If anything seems suspicious, change your

USD/CAD Weekly Outlook - ActionForex

USD/CAD Weekly Outlook – ActionForex

USD/CAD’s rebound from 1.3480 accelerated high last week. Initial bias stays on the upside this week for 38.2% retracement of 1.4791 to 1.3480 at 1.3981. Decisive break there will argue that it’s already reversing the whole down trend from 1.4791, and target 61.8% retracement at 1.4290. On the downside, below 1.3844 minor support will turn

EUR/GBP Weekly Outlook - ActionForex

EUR/GBP Weekly Outlook – ActionForex

EUR/GBP stayed in range trading above 0.8610 last week. Initial bias remains neutral this week first. On the upside, sustained break above 55 D EMA (now at 0.8680) will confirm short term bottoming, and bring stronger rebound back to 0.8788 resistance. However, rejection by 55 D EMA will set up another fall through 0.8611 to

GBP/JPY Weekly Outlook - ActionForex

GBP/JPY Weekly Outlook – ActionForex

GBP/JPY edged higher last week but failed to break through 213.28 resistance and retreated. Initial bias stays neutral this week first. On the upside, firm break of 213.28 will resume the rise from 207.20 to retest 214.98 high. However, break of 210.77 will bring deeper fall back to 209.15 support and below. In the bigger

USD/CHF Weekly Outlook - ActionForex

USD/CHF Weekly Outlook – ActionForex

USD/CHF’s rally from 0.7603 resumed last week by breaking through 0.7957. Initial bias stays on the upside for 38.2% retracement of 0.9200 to 0.7603 at 0.8213. For now, further rally is expected as long as 0.7833 support holds, in case of retreat. In the bigger picture, a medium term bottom should be in place at

USD/JPY Weekly Outlook - ActionForex

USD/JPY Weekly Outlook – ActionForex

USD/JPY’s rally from 152.25 resumed by breaking through 159.88 resistance last week. Initial bias remains on the upside and further rise should be seen to retest 161.94 high next. On the downside, below 159.35 minor support will turn intraday bias neutral first. But near term outlook will stay bullish as long as 157.49 support holds,

EUR/USD Weekly Outlook - ActionForex

EUR/USD Weekly Outlook – ActionForex

EUR/USD remains bounded in consolidations above 1.1408 last week and outlook is unchanged. Initial bias stays neutral this week first. Further decline is expected with 1.1666 cluster resistance (38.2% retracement of 1.2081 to 1.1408 at 1.1665) intact. On the downside, firm break of 1.1408 will resume the fall from 1.2081 to 38.2% retracement of 1.0176

AUD/USD Weekly Report - ActionForex

AUD/USD Weekly Report – ActionForex

AUD/USD’s extended decline last week should confirm medium term topping at 0.7187. Initial bias remains on the downside this week for 38.2% retracement of 0.5913 to 0.7187 at 0.6700. On the upside, above 0.6956 minor resistance will turn intraday bias neutral first. But risk will stay on the downside as long as 0.7187 resistance holds,

EUR/JPY Weekly Outlook - ActionForex

EUR/JPY Weekly Outlook – ActionForex

EUR/JPY’s rebound from 182.02 extended higher last week but retreated just ahead of 184.75 resistance. Initial bias remains neutral this week first. On the upside, break of 184.75 will resume the rise from 180.78 to retest 186.86 high. On the downside, however, below 183.17 minor support will turn bias back to the downside for 182.02

EUR/AUD Weekly Outlook - ActionForex

EUR/AUD Weekly Outlook – ActionForex

EUR/AUD’s extended rebound last week confirmed short term bottoming at 1.6125. Initial bias stays on the upside this week. Sustained break of 55 D EMA (now at 0.6756) will pave the way to 38.2% retracement of 1.8554 to 1.6125 at 1.7053. On the downside, below 1.6607 minor support will turn intraday bias neutral first. In

Quick Jumps and Fast Dives

Quick Jumps and Fast Dives

Created on March 26, 2026 Last Friday the NZD/USD was above 0.58900 a couple of times. The currency pair was within sight of the 0.61000 mark towards the end of January. On the 27th of February the NZD/USD was close to 0.60075. As of this morning the realm of 0.57860 is being seen with fast

GBP/USD Chart Alert: Bull Flag Pattern in Play Ahead of Retail Sales Data

GBP/USD Chart Alert: Bull Flag Pattern in Play Ahead of Retail Sales Data

GBP/USD is under pressure due to cautious market sentiment, USD strength stemming from Middle East ceasefire strains, and uncertainty following President Trump’s delay of Iran’s energy plant destruction. Technical analysis reveals a bull flag pattern on the H1 chart, suggesting a potential 100-pip rally If the price fails to clear the 200 SMA and breaks

GBP/USD Analysis 27/03: Pound Trades Near Fair Value (Chart)

Pound Trades Near Fair Value (Chart)

Created on March 27, 2026 British pound continues to see a lot of noisy sideways trading. British pound dropped initially during the trading session on Thursday but has turned around to show signs of life again as the market continues to bang around in a fairly well-defined range. The 200-day EMA sits right about where

USD/CAD Daily Outlook - ActionForex

USD/CAD Daily Outlook – ActionForex

Daily Pivots: (S1) 1.3820; (P) 1.3844; (R1) 1.3886; More… USD/CAD’s rally from 1.3480 is in progress and intraday bias remains on the upside. It’s seen as correcting the whole down trend from 1.4791 and should target 1.3927 resistance, or probably further to 38.2% retracement of 1.4791 to 1.3480 at 3981. On the downside, below 1.3816

L&G Asset Management global head of trading appointed global head of markets

L&G Asset Management global head of trading appointed global head of markets

Ed Wicks has been promoted to head of global markets at Legal & General Asset Management, a newly created role for the firm.   Wicks’ promotion marks an extension of his ongoing eight-year long tenure at the asset manager, having initially joined in 2015 as head of equity trading.   He later stepped up as global head

GBP/JPY Consolidates Within Ascending Trend Channel Near 212.00

GBP/JPY Consolidates Within Ascending Trend Channel Near 212.00

GBP/JPY’s month‑long sustained upside meets strong resistance. Momentum signals reflect signs of bullish exhaustion. GBP/JPY’s steady ascent within a month‑long upward‑sloping channel is showing signs of stabilisation, with price action repeatedly meeting strong resistance near the upper Bollinger band at 213.30. The broader bias remains bullish as the pair continues to trade above the long‑term

0
Would love your thoughts, please comment.x
()
x