BTC/USD Forex Signal 16/02: Resistance at $71,762 (Chart)

My previous BTC/USD signal on 9th February was not triggered.

image

Today’s BTC/USD Signals

  • Risk 0.50% per trade.
  • Trades may only be entered before 5pm Tokyo time Tuesday.

Long Trade Ideas

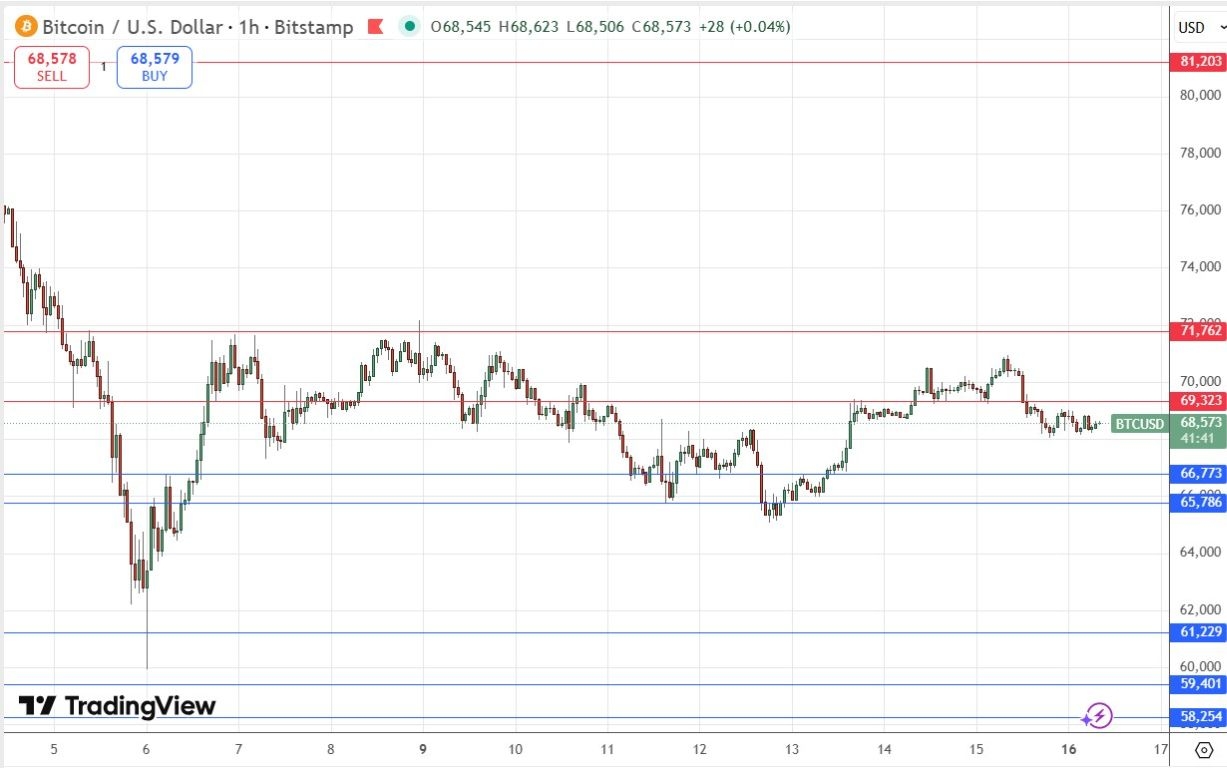
  • Go long after a bullish price action reversal on the H1 timeframe following the next touch of $66,773, $65,786, $61,229, or $59,401.
  • Place the stop loss $100 below the local swing low.
  • Adjust the stop loss to break even once the trade is $100 in profit by price.
  • Take off 50% of the position as profit when the trade is $100 in profit by price and leave the remainder of the position to ride.

Short Trade Ideas

  • Go short after a bullish price action reversal on the H1 timeframe following the next touch of $69,323, $71,762, or $81,203.
  • Place the stop loss $100 above the local swing high.
  • Adjust the stop loss to break even once the trade is $100 in profit by price.
  • Take off 50% of the position as profit when the trade is $100 in profit by price and leave the remainder of the position to ride.

The best method to identify a classic “price action reversal” is for an hourly candle to close, such as a pin bar, a doji, an outside or even just an engulfing candle with a higher close. You can exploit these levels or zones by watching the price action that occurs at the given levels.

BTC/USD Analysis

In my last BTC/USD forecast exactly one week ago, I thought that the resistance level at $71,762 firmly containing the price was likely to be pivotal and decisive.

This was a good call as the resistance level has held since then, in fact, the level has not even been tested.

The price has just been consolidating below this resistance level over the pas week. There is another key level below it at $69,323 and the price is also below that, which makes the outlook a little more bearish. However, on the bullish side, we have seen a halt to the bearish momentum and a reasonably deep bullish retracement. When you also consider that Bitcoin tends to find long-term buyers after it makes steep falls, it starts to look as if the downwards move might be over.

Despite these bullish factors, Bitcoin and crypto generally has been acting unhealthily for several months so, so I would not rule out a further fall.

I will look to the pivotal level at $71,762:

  1. A bullish breakout beyond this will likely produce a move higher to at least $81,203.
  2. A clear failed test and bearish reversal could be an excellent entry signal for a short trade.

There is nothing of high importance due today regarding either Bitcoin or the US Dollar.

Ready to trade our free Forex signals? Here is our list of the best MT4 crypto brokers worth checking out.

Source link

Visited 1 times, 1 visit(s) today

Related Article

Silver Plays Its Own Game

Silver Plays Its Own Game

Precious metals are diverging due to different market structures. Dollar under pressure before US GDP and EU business activity releases. The slowdown in US CPI from 2.7% to 2.4% has halted the advance of the US dollar. If inflation returns to its 2% target without a recession, the Fed will not need to keep rates

Gold is Getting Cheaper, But It Is Not Critical

Gold is Getting Cheaper, But It Is Not Critical

Gold on Monday fell to 4980 USD per ounce after rising more than 2% in the previous session. The volatility was driven by weaker-than-expected US inflation data. Soft CPI data has boosted expectations of a Fed rate cut this year, and the market is now pricing in just over two cuts. Investors’ focus was on

NZDUSD Validates Blue Box Strategy, Offers Buy Setup

NZDUSD Validates Blue Box Strategy, Offers Buy Setup

In this technical blog, we will look at the past performance of the 1-hour Elliott Wave Charts of NZDUSD. In which, the rally from 21 November 2025 low is unfolding as an impulse & showed a higher high sequence therefore, called for an extension higher to take place. We knew that the structure in NZDUSD

Eurozone industrial output contracts -1.4% mom in December, capital goods drag

Eurozone industrial output contracts -1.4% mom in December, capital goods drag

Eurozone industrial production fell -1.4% mom in December, slightly better than expectation of -1.5% mom, but still signaling weak momentum into year-end. . By category, capital goods output in Eurozone dropped sharply by -1.9%, highlighting fragile business investment conditions. Production of intermediate goods edged down -0.1%, energy slipped -0.3%, and non-durable consumer goods fell -0.3%.

USD/JPY Daily Outlook - ActionForex

USD/JPY Daily Outlook – ActionForex

Daily Pivots: (S1) 152.31; (P) 152.99; (R1) 153.38; More… Intraday bias in USD/JPY remains neutral for the moment. With 38.2% retracement of 139.87 to 159.44 at 151.96 intact, price actions from 159.44 are seen as a consolidations pattern only. On the upside, firm break of 154.63 minor resistance will bring stronger rebound towards 157.65. However,

Cboe Silexx enhances equities display, symbol column sorting

Cboe Silexx enhances equities display, symbol column sorting

Cboe Silexx, a multi-asset order execution management system (OEMS) that caters to the professional marketplace, has announced the release of version 26.3. Closing Price | Current Day Closing Price Display Equities now display the current day’s official closing price in a new Close column across multiple modules including: Order Ticket’s Quote Panel Portfolio Watchlist Risk

EUR/USD At Pivotal Juncture As Sellers Guard Resistance

EUR/USD At Pivotal Juncture As Sellers Guard Resistance

Key Highlights EUR/USD found support at 1.1765 and corrected some losses. A key bullish trend line is forming with support at 1.1850 on the 4-hour chart. GBP/USD is consolidating above the 1.3600 support. Gold prices could resume upside if there is a move above $5,150. EUR/USD Technical Analysis The Euro dipped below 1.1800 against the

Weekly Forex Forecast - 16th to 20th February 2026 (Charts)

Weekly Forex Forecast – 16th to 20th February 2026 (Charts)

I wrote on the 8th February that the best trades for the week would be: Long of the Dow Jones Industrial Average. This gave a loss of 1.09% over the week. A summary of last week’s most important data in the market: US CPI (inflation) – this came in just a fraction lower than expected,

The US GDP, PCE and FED Minutes Add Further Intrigue This Week

Forex Signals Feb 16: Walmart, BHP, Moody’s, DoorDash and Palo Alto Earnings Preview

A diverse group of global heavyweights—including Walmart, BHP, and Palo Alto Networks—are set to report earnings, offering fresh insight. Written by: Skerdian Meta • Sunday, February 15, 2026 • 5 min read • Last updated: Sunday, February 15, 2026 Add an article to your Reading List Register now to be able to add articles to

GBP/USD Weekly Forecast - 15/2: Market Look Upwards? (Chart)

GBP/USD Weekly Forecast – 15/2: Market Look Upwards? (Chart)

Created on February 15, 2026 When the GBP/USD begins trading tomorrow it will take place under a cautious banner which has produced rather choppy results the past month. The currency pair is still within its long-term higher realm, but below its apex values achieved in late January when the 1.38500 was challenged. However, as the

USD/INR exchange rate analysis showing interim trade deal impact on Indian rupee gains

How the Interim Trade Deal Curbing Rupee Gains Impacts 2025 Markets

BitcoinWorldUSD/INR Exchange Rate: How the Interim Trade Deal Curbing Rupee Gains Impacts 2025 Markets NEW DELHI, March 2025 – The USD/INR currency pair enters a critical phase as analysts from Mitsubishi UFJ Financial Group (MUFG) highlight a significant constraint. According to their latest assessment, the recently negotiated interim trade deal between the United States and

EUR/AUD Weekly Outlook - ActionForex

EUR/AUD Weekly Outlook – ActionForex

EUR/AUD’s decline resumed last week and hit 1.6620, but recovered since then. Initial bias remains neutral this week for consolidations. Outlook will stay bearish as long as 1.7060 resistance holds. Break of 1.6620 will resume larger down trend from 1.8554 to 138.2% projection of 1.8554 to 1.7245 from 1.8160 at 1.6351 next. However, firm break

USD/JPY Weekly Outlook - ActionForex

USD/JPY Weekly Outlook – ActionForex

USD/JPY fell sharply last week but the decline lost momentum ahead of 152.07 support. Intial bias stays neutral this week first. With 38.2% retracement of 139.87 to 159.44 at 151.96 intact, price actions from 159.44 are seen as a consolidations pattern only. On the upside, sustained break of 55 4H EMA (now at 154.51) will

EUR/JPY Weekly Outlook - ActionForex

EUR/JPY Weekly Outlook – ActionForex

EUR/JPY fell sharply last week but the declined stalled after hitting 38.2% retracement of 172.24 to 186.86 at 181.27. Initial bias is neutral this week first. On the downside, sustained break of 181.27 will argue that fall from 186.86 is correcting whole up trend from 154.77. Next near term target will be 161.8% projection of

USD/CHF Weekly Outlook - ActionForex

USD/CHF Weekly Outlook – ActionForex

USD/CHF stayed in consolidations from 0.7603 last week. Initial bias stays neutral this week first. Stronger rebound cannot be ruled out but upside should be limited by 55 D EMA (now at 0.7861) to complete the pattern. On the downside, break of 0.7603 will resume larger down trend, and target 0.7382 projection level next. In

EUR/USD Weekly Outlook - ActionForex

EUR/USD Weekly Outlook – ActionForex

EUR/USD’s rebound stalled after hitting 1.1928 last week and retreated. Initial bias stays neutral this week first. On the upside, above 1.1928 will target a retest on 1.2081 high. Decisive break there and sustained trading above 1.2 psychological level will carry larger bullish implications. On the downside, however, sustained trading below 55 D EMA (now

EUR/GBP Weekly Outlook - ActionForex

EUR/GBP Weekly Outlook – ActionForex

EUR/GBP edged higher last week but failed to break through 0.8744 resistance. Initial bias remains neutral this week first. Firm break of 0.8744 will indicate that fall from 0.8863 has completed as a correction. Further rally should then be seen back to retest 0.8863 high. On the downside, sustained break of 38.2% retracement of 0.8221

NAGA Group sees 3.5% increase in 2025 Revenue to €65.4 million

NAGA Group sees 3.5% increase in 2025 Revenue to €65.4 million

Online trading brokerage operator The NAGA Group AG (ETR:N4G0) has reported its financial results for 2025 – the company’s first full year operating after the NAGA-CAPEX.com merger – achieving strong top line results and maintaining profitability while integrating the two brands, all in a fairly challenging market environment. Despite what the company called a structurally

Supreme Court Tariff Decision and Key Tests Ahead – Markets Weekly Outlook

Supreme Court Tariff Decision and Key Tests Ahead – Markets Weekly Outlook

Discover our Weekly Market Outlook, exploring themes and events that forged financial flows throughout the week. After a volatile stretch, traders buckle for a heavy-slate of US data. Get ready for next week’s action by exploring upcoming events across global Markets. Week in review – Volatile swings and deleveraging continue Markets are subject to particular

0
Would love your thoughts, please comment.x
()
x