AUD/USD Weekly Forecast: Solid Jobs Data Boosts Aussie

  • The AUD/USD weekly forecast shows continued strength in Australia’s labor market.
  • The Reserve Bank of Australia implemented its first rate cut this week.
  • Data revealed a sharp decline in business activity in the US service sector.

This AUD/USD weekly forecast highlights the significant impact of Australia’s strong labor market on the appreciation of the Australian dollar.

Ups and downs of AUD/USD

The AUD/USD pair had a bullish week despite an RBA rate cut on Tuesday. The strength came from an upbeat employment report from Australia and a weak dollar. 

Are you interested to learn more about day trading brokers? Check our detailed guide-

The Reserve Bank of Australia implemented its first rate cut this week but remained cautious due to labor market strength. Data on Thursday revealed an unexpected jump in job growth in Australia. Meanwhile, the US dollar was fragile amid hopes for a trade deal between the US and China. At the same time, data on Friday revealed a sharp decline in business activity in the US service sector.

Next week’s key events for AUD/USD

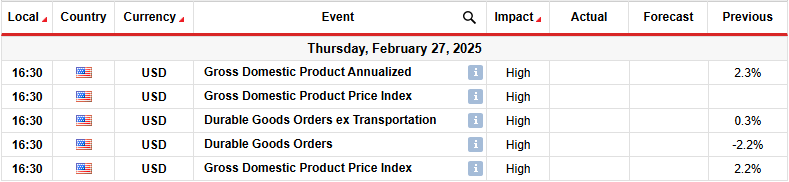
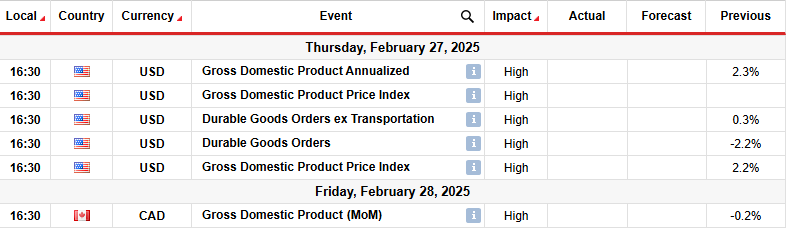
Next week, market participants will focus on US GDP and core durable goods data. The US economy has shown resilience in 2025, with only a few weak spots, such as retail sales. As a result, the outlook for the Fed remains mostly hawkish, with market participants expecting only two cuts this year. 

Upbeat GDP data might further lower rate-cut expectations, boosting the dollar. On the other hand, if economic growth disappoints, rate cut expectations will increase, hurting the greenback

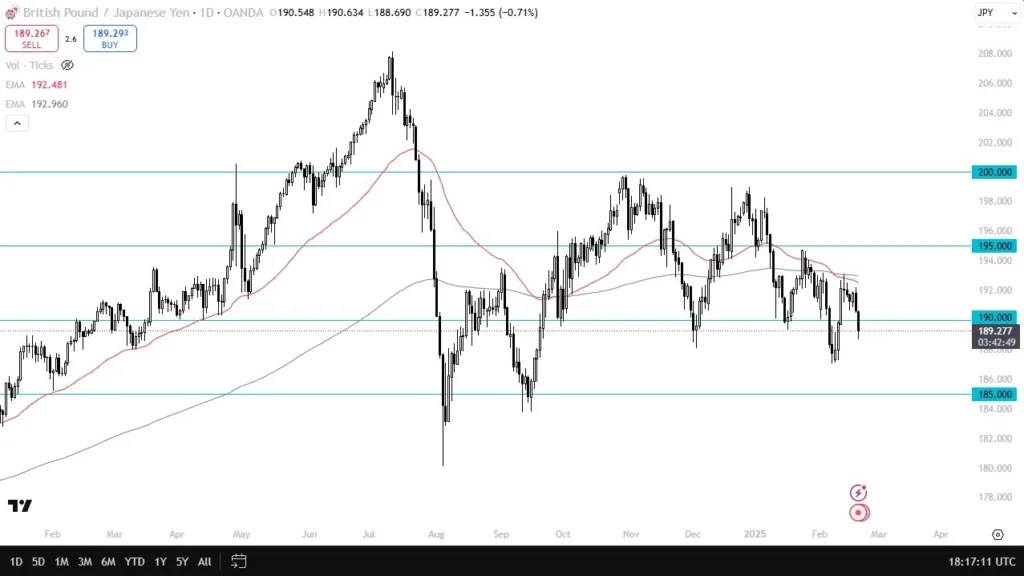
AUD/USD weekly technical forecast: Bulls face the 0.382 Fib retracement level

AUD/USD weekly technical forecastAUD/USD weekly technical forecast
AUD/USD daily chart

On the technical side, the AUD/USD price trades above the 22-SMA with the RSI above 50, supporting a bullish bias. The trend recently reversed when bears paused at the 0.6100 support level. Bears gradually lost momentum as the price approached this level, allowing bulls to emerge and break above the 22-SMA. At the same time, the RSI broke above 50, indicating stronger bullish momentum. 

However, bulls face a strong resistance zone comprising the 0.382 Fib retracement and the 0.6401 key level. If the bulls are strong, they will break above this zone to make new highs. However, the price might pull back to retest the SMA before climbing higher. 

On the other hand, if the zone holds firm, bears might overpower bulls to break below the SMA and retest the 0.6100 support. A break below this level would confirm a continuation of the previous downtrend.

Looking to trade forex now? Invest at eToro!

67% of retail investor accounts lose money when trading CFDs with this provider. You should consider whether you can afford to take the high risk of losing your money.

Source link

Visited 1 times, 1 visit(s) today

Related Article

EUR/USD Chart Analysis: Exchange Rate Hits Highest Level Since Early February

The EUR/USD chart shows the euro rising above its previous February peak of 1.05155, set on the 14th. On one hand, the euro’s strength is driven by Germany’s national elections over the weekend, where the opposition conservatives, led by Friedrich Merz, secured victory as expected. Investors are now focused on how quickly Merz’s party can

Pepperstone increases US share CFDs offering for 24-hour trading

Pepperstone increases US share CFDs offering for 24-hour trading

Leading Australia based Retail FX and CFDs broker Pepperstone has announced that it is adding 79 new 24-hour US share CFDs to its lineup, to now offer over 100 of the most-traded US stocks. This gives traders unparalleled opportunity to capitalise on market-moving events even outside of equity exchange hours. These additions come in the

20250223augold

Gold is enjoying its best run – since the 2020 top

By Friday’s close, gold had risen for an eight consecutive week. And that marks its best run since the 2020 top, which chalked up an impressive nine consecutive weeks of gains. It could suggest that gold’s rally is getting stale, but it is so close to the $3,000 milestone that it is hard to imagine

Crude Oil Weekly Forecast - 23/02: Flourishes Upward (Chart)

Crude Oil Weekly Forecast – 23/02: Flourishes Upward (Chart)

Created on February 23, 2025 Classical speculative trading conditions were seen in WTI Crude Oil last week. Last Monday started with some slight selling in which the 70.100 realm was challenged, followed by incremental buying, and leading to the week’s apex near the 73.090 ratio late on Thursday. And then like healthy commodity markets often

Gold 230225

Weekly Pairs in Focus – February 23, 2025 (Charts)

Created on February 23, 2025 The euro has fallen a bit during the trading week, as the 1.05 level has offered a bit of a ceiling. However, we have been all over the place, so it shows that we have a lot of volatility in general. When you look at the chart, the area above

Weekly Forex Forecast - February 23

Weekly Forex Forecast – February 23

I wrote on 16th February that the best trade opportunities for the week were likely to be: Long of the NASDAQ 100 Index. This fell by 2.48% over the week. Long of the S&P 500 Index following a daily close above 6118.71. This fell by 1.77% over the week. Long of Gold in USD terms

GBP/USD Weekly Forecast 23/02: Higher Prices (Chart)

GBP/USD Weekly Forecast 23/02: Higher Prices (Chart)

Created on February 23, 2025 Bullish speculators of the GBP/USD may be in a relatively good mood after the past week and half of trading in the currency pair. The ability of the GBP/USD to hold ground above the 1.26000 level is likely seen as a positive result. The currency pair touched a high of

USD/CAD Weekly Forecast: Dollar Rebounds on Auto Tariff Plan

USD/CAD Weekly Forecast: Dollar Rebounds on Auto Tariff Plan

The USD/CAD weekly forecast shows a slight rebound in the dollar. Trump is ready to implement more tariffs, including on automobiles. Canadian data revealed solid underlying inflation and upbeat sales. The USD/CAD weekly forecast indicates a modest rebound of the dollar following Trump’s proposal for automobile tariffs. Ups and downs of USD/CAD The USD/CAD pair

EUR/GBP Weekly Outlook – Action Forex

EUR/GBP’s decline from 0.8472 resumed by breaking through 0.8290 support last week. Initial bias stays on the downside this week despite weak momentum. Further fall should be seen to retest 0.8221 low. Nevertheless, firm break of 0.8308 minor resistance will turn bias back to the upside for stronger rebound to 0.8376 resistance instead. In the

EUR/USD Weekly Outlook – Action Forex

Range trading continued in EUR/USD last week and outlook is unchanged. Initial bias remains neutral this week first. Price actions from 1.0176 are seen as a corrective pattern only. IN case of further rise, upside should be limited by 38.2% retracement of 1.1213 to 1.0176 at 1.0572. On the downside, break of 1.0400 support will

Franklin Templeton Files For Solana ETF

sol-usd Olumide Adesina•Saturday, February 22, 2025•1 min read Add an article to your Reading List Register now to be able to add articles to your reading list. ” aria-hidden=”true”> Share in Facebook “> MARKETS TREND The market trend factors in multiple indicators, including Simple Moving Average, Exponential Moving Average, Pivot Point, Bollinger Bands, Relative Strength

GCEX releases multi-asset trade allocation tool XplorAllocate

GCEX releases multi-asset trade allocation tool XplorAllocate

Copenhagen, London and Dubai based digital assets prime brokerage GCEX Group has announced the launch of XplorAllocate – a multi-asset tool designed to help fund managers and professional traders allocate trades more efficiently, accurately, and transparently across crypto spot, crypto derivatives, forex CFDs, and traditional financial products. The company describes XplorAllocate as a smarter way for

USD/JPY Falls to 2-Month Low Near ¥150

Created on February 20, 2025 The Japanese Yen strengthened firmly during today’s Asian session, sending the benchmark USD/JPY currency pair down to a fresh 2-month low close to the big round number at ¥150. In the Forex market, the Japanese Yen has easily been the strongest major currency since today’s Tokyo open, while the US

Get our exclusive guide to USD/JPY trading in 2025

USDJPY Drops to 150, EURUSD Holds Ahead of Flash PMIs

Key Events: FOMC minutes confirm rate hold expectations and ongoing inflation concerns USDJPY drops to December 2024 lows as Japanese 10Y government bond yields surge to 16-year highs EURUSD holds above 1.04 ahead of key economic data Upcoming Events: Flash PMI indicators for Japan, the Eurozone, the UK, and the US USDJPY Drops to December

FOREX.com to Exhibit at Invest Cuffs Conference in Krakow

FOREX.com to Exhibit at Invest Cuffs Conference in Krakow

KRAKOW, Poland, Feb. 21, 2025 (GLOBE NEWSWIRE) — FOREX.com, a subsidiary of StoneX Group Inc. (“StoneX”; NASDAQ: SNEX), is proud to announce its participation in the upcoming Invest Cuffs conference as the official Chillout Zone Partner. The event will take place in Krakow on March 28-29, marking FOREX.com’s inaugural presence at one of Poland’s most

GBP/USD technical price analysis

GBP/USD Analysis: UK Retail Growth Increases Optimism

The GBP/USD price analysis indicates a recovery in UK consumer spending. UK retail sales jumped by 1.7% in January. The greenback fell on Friday after reports that Trump will soon host China’s president. The GBP/USD price analysis indicates a recovery in the UK economy after a better-than-expected retail sales report. The upbeat report has lowered

Canadian Dollar Eyes Retail Sales

The Canadian dollar is showing small losses on Friday. USD/CAD is trading at 1.4196 in the European session, up 0.14%. On Thursday, the Canadian dollar took advantage of broad US dollar weakness and gained 0.45%. Canada’s retail sales expected to jump Will the week end on a high note? Canada releases retail sales for December

GBP/JPY Forecast Today 21/02: Struggles Near 190 (Video)

GBP/JPY Forecast Today 21/02: Struggles Near 190 (Video)

Created on February 21, 2025 The British pound has broken significantly below the 190 yen level and then broke significantly lower than that. That being said, the market has turned around to show signs of somewhat resilient behavior. If we can turn around and break above the 190 yen level, I think that could be

0
Would love your thoughts, please comment.x
()
x