Corrections are Normal
Various factors, including economic data, geopolitical events, central bank policy, investor sentiment, or simple shifts in supply and demand for equities can trigger corrections. Often, in robust bull markets, investors can forget that corrections serve as a natural part of the market’s cycle. Did you know that over the past 60 years, more than nine in ten calendar years see a correction of 5% or more, while more than half of all years see a 10% correction or more? These corrections are necessary for markets to adjust and recalibrate, allowing sentiment to cool, overvalued stocks to become cheaper, and buying opportunities to emerge. While corrections are a necessary evil, how can investors tell when they are over? Below are 5 clues to look for:
An Undercut & Shakeout of Lows
Equity markets are the master manipulator. For example, to move higher, they first must undercut a previous support level and shake out “weak hands.” In the current market environment, investors should look for an undercut of the August low ($354.71) in the leading equity index, the Nasdaq 100 ETF (QQQ), and a subsequent reversal back above the level.
Image Source: TradingView
Seasonal Tailwinds
In 2023, historic seasonal trends have perhaps been the best, most accurate roadmap for investors. The pre-presidential election roadmap is the optimal roadmap for investors to consult. Typically, equities rally into the late summer (like in 2023) and bottom in late October.
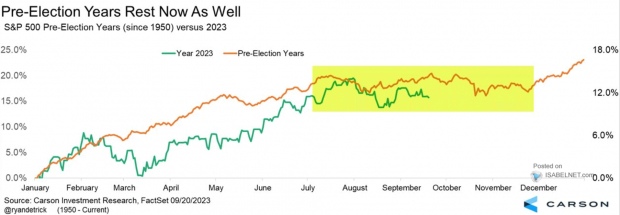
Image Source: Ryan Detrick, Carson Research
A Spike in Fear
Fear and greed are powerful emotional drivers in equity markets. If investors are all on the same side of the boat, the market will likely do the opposite. Investors looking for a bottom in equities should use sentiment indicators to look for a spike in fear (contrarian indicator). This week, the CNN Fear & Greed Indicator moved to fear (a step in the right direction). While there is still room for more bearishness, sentiment is moving in the right direction.
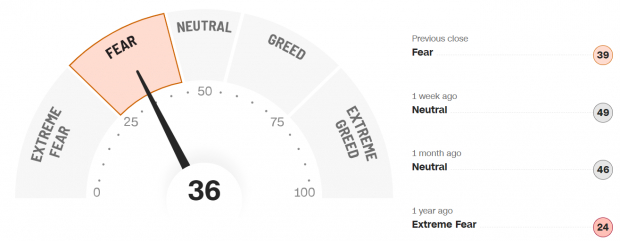
Image Source: CNN
Return of Strong Breadth
Market breadth measures the overall participation of stocks. In 2023, tech and energy stocks such as Nvidia (NVDA) and Valero (VLO) have carried the market on their shoulders. However, weak market segments such as the SPDR Regional Banking ETF (KRE) and Russell 2000 Index ETF (IWM), are dragging down equities. Stabilization in small caps and banks would go a long way to helping the market find a sustainable bottom.
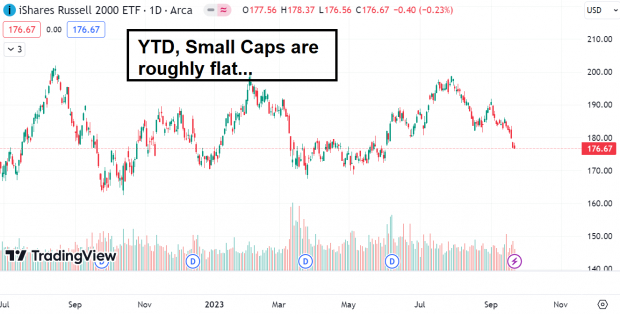
Image Source: TradingView
Volatility Spike
The Volatility Index (VIX) measures the market’s expectation of future volatility. A spike in VIX (over 20) is evidence of excessive fear and indicates a stock market bottom is close.
Bottom Line
Corrections are ordinary and necessary during bull markets – especially in the seasonally weak month of September. Investors who wait for the subtle clues mentioned above can use these corrections and generate alpha.
Top 5 ChatGPT Stocks Revealed
Zacks Senior Stock Strategist, Kevin Cook names 5 hand-picked stocks with sky-high growth potential in a brilliant sector of Artificial Intelligence. By 2030, the AI industry is predicted to have an internet and iPhone-scale economic impact of $15.7 Trillion.
Today you can invest in the wave of the future, an automation that answers follow-up questions … admits mistakes … challenges incorrect premises … rejects inappropriate requests. As one of the selected companies puts it, “Automation frees people from the mundane so they can accomplish the miraculous.”
Download Free ChatGPT Stock Report Right Now >>
NVIDIA Corporation (NVDA) : Free Stock Analysis Report
Valero Energy Corporation (VLO) : Free Stock Analysis Report
Invesco QQQ (QQQ): ETF Research Reports
iShares Russell 2000 ETF (IWM): ETF Research Reports
SPDR S&P Regional Banking ETF (KRE): ETF Research Reports
To read this article on Zacks.com click here.
The views and opinions expressed herein are the views and opinions of the author and do not necessarily reflect those of Nasdaq, Inc.