ICE Futures U.S. Sugar No.11 Contract
| Settlement (cUS$/lb) | Open | High | Low | Last | Volume | O/I | Life High | Life Low | |||
|---|---|---|---|---|---|---|---|---|---|---|---|
*Volume includes exchange for physicals.
ICE U.S. Sugar No.11 – Spreads
| Date | Spread | Date | Spread |
|---|---|---|---|
| Mar27 / May27 | 0.53 | Oct27 / Mar28 | -0.40 |
| Mar27 / Jul27 | 0.87 | Oct27 / May28 | 0.57 |
| Mar27 / Oct27 | 0.86 | Mar28 / May28 | 0.97 |
| Mar27 / Mar28 | 0.46 | Mar28 / Jul28 | 1.44 |
| May27 / Jul27 | 0.34 | May28 / Jul28 | 0.47 |
| May27 / Oct27 | 0.33 | May28 / Oct28 | 0.48 |
| Jul27 / Oct27 | -0.01 | Jul28 / Oct28 | 0.01 |
| Jul27 / Mar28 | -0.41 | Jul28 / Mar29 | -0.44 |
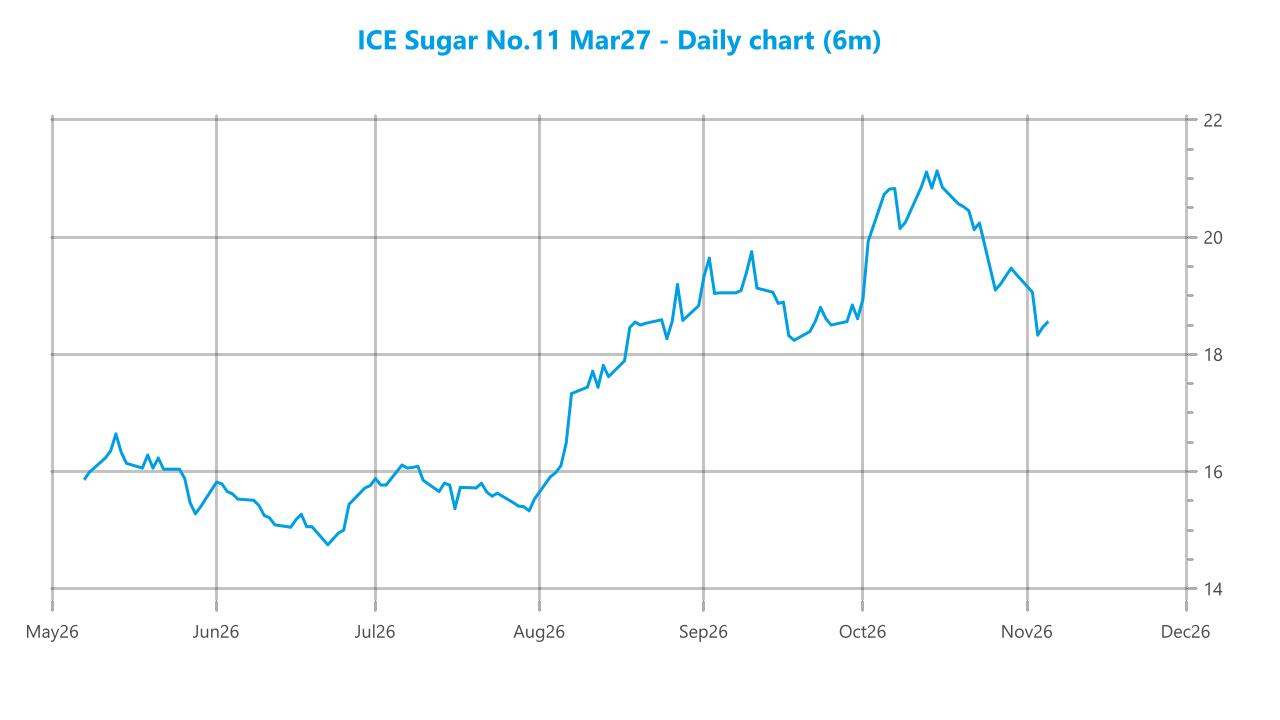
No.11 opened at 18.59 and initially edged higher, briefly reaching the session high of 18.60 before selling pressure emerged. Prices then moved steadily lower through the early part of the session, with a few short-lived recovery attempts failing to generate sustained momentum. The decline accelerated later in the morning, although the market managed a partial rebound and traded more unevenly around the middle of the session. Renewed selling subsequently pushed No.11 lower again through the afternoon, eventually taking prices to the session low of 18.13 during the later part of the day. Support emerged around that level, allowing the market to stabilize and begin a gradual recovery. Prices moved progressively higher into the closing stages, though the rebound remained well below the opening area. No.11 finished at 18.24, recovering 11 points from the session low but still leaving the market sharply lower from the open after a session dominated by persistent selling pressure.
ICE Europe White Sugar Futures Contract
| Settlement (US$/mt) | Open | High | Low | Last | Volume | O/I | Life High | Life Low | |||
|---|---|---|---|---|---|---|---|---|---|---|---|
*Volume includes exchange for physicals.
ICE Europe White Sugar – Spreads
| Date | Spread | Date | Spread |
|---|---|---|---|
| Dec26 / Mar27 | -13.60 | Mar27 / May27 | 0.00 |
| Dec26 / May27 | -13.60 | May27 / Aug27 | 3.70 |
| Dec26 / Aug27 | -9.90 | Aug27 / Oct27 | 4.90 |
| Dec26 / Oct27 | -5.00 | Oct27 / Dec27 | 3.10 |
White Sugar Premium
| Date | Premium | Date | Premium |
|---|---|---|---|
| Mar27 / Mar27 | 113.68 | Jul28 / Aug28 | 127.87 |
| May27 / May27 | 125.36 | Oct28 / Oct28 | 120.29 |
| Jul27 / Aug27 | 129.16 | Mar29 / Mar29 | 109.06 |
| Oct27 / Oct27 | 124.04 | May29 / May29 | 114.32 |
| Mar28 / Mar28 | 110.72 | Jul29 / Aug29 | 115.51 |
| May28 / May28 | 125.60 |
*Values calculated basis 6:10 PM.
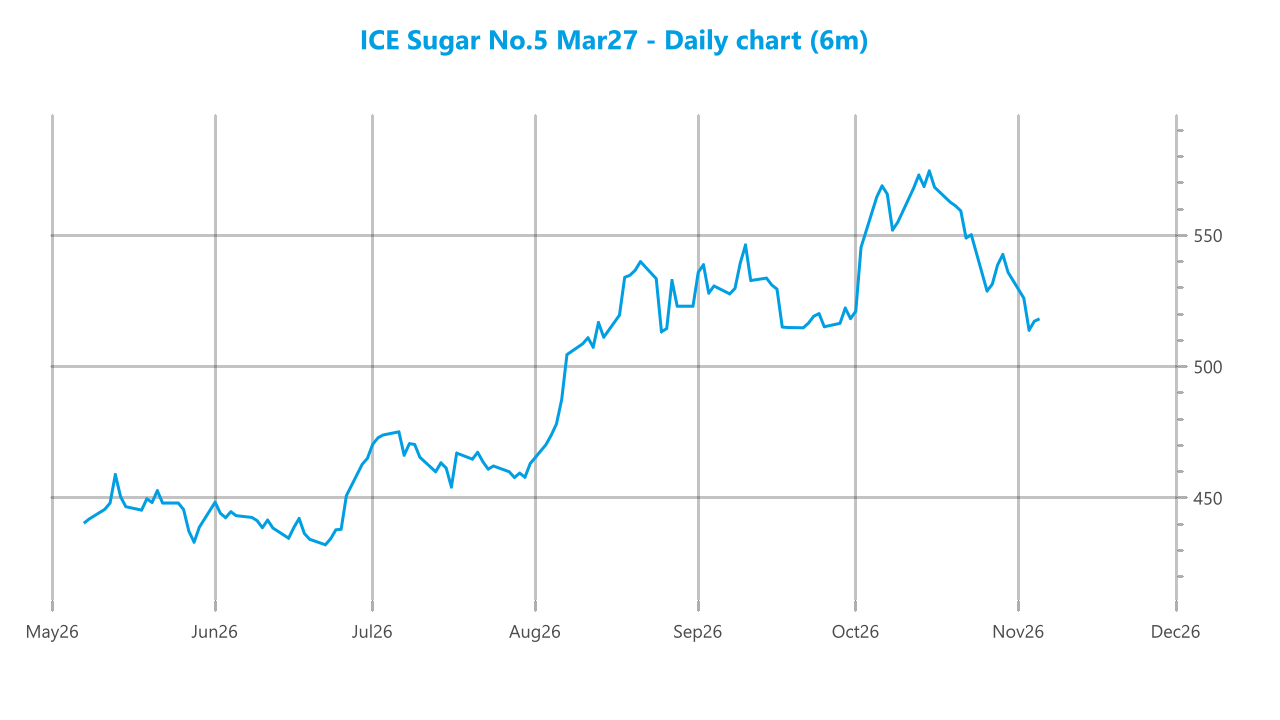
No.5 opened at 498.40 and initially moved higher, with early buying lifting prices before the market reversed and came under pressure through the morning. The decline became increasingly pronounced, eventually driving No.5 to the session low of 495.10. Support emerged at the lower levels and prices rebounded sharply, although the recovery remained volatile with several sizeable swings around midday and into the early afternoon. Another bout of selling later pushed the market back toward the lower end of the range, but the weakness proved short-lived. From there, the tone improved noticeably, with prices recovering steadily through the late afternoon and moving back above the opening level. Buying accelerated into the final part of the session, taking No.5 to the day’s high of 503.80. The market eased briefly from the peak but remained firm into the finish, closing at 502.20 and retaining a solid gain versus the open.