European Undervalued Small Caps With Insider Action To Watch In May 2026
As European markets navigate the complexities of stalled geopolitical negotiations and fluctuating oil prices, the pan-European STOXX Europe 600 Index remains largely stable with a slight uptick. Amid these broader market dynamics, small-cap stocks present intriguing opportunities, particularly when insider actions suggest potential value shifts in a landscape marked by cautious economic sentiment and evolving fiscal policies.
Top 10 Undervalued Small Caps With Insider Buying In Europe
Let’s uncover some gems from our specialized screener.
Simply Wall St Value Rating: ★★★★★☆
Overview: MONY Group operates across various sectors including money, travel, cashback, insurance, and home services with a market capitalization of £1.23 billion.
Operations: The company’s revenue is primarily driven by its Insurance segment, contributing £232.50 million, followed by Money and Cashback segments at £105.70 million and £52.70 million, respectively. Gross profit margin has shown a decreasing trend from 80.20% in June 2015 to 64.35% in December 2025, indicating changes in cost management or pricing strategies over time. Operating expenses are substantial with General & Administrative Expenses consistently being the largest component within this category across the periods analyzed.
PE: 11.2x
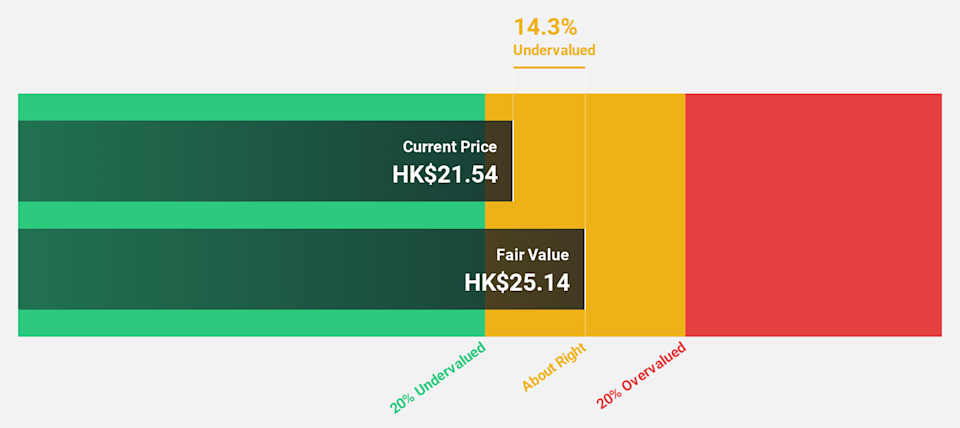
MONY Group stands out as a smaller European company with potential due to its innovative approach in the price comparison sector. The rollout of their MoneySuperMarket ChatGPT app, which has already saved over 100,000 customers an average of £25, demonstrates their commitment to technological advancement. Insider confidence is evident with share repurchases up to £25 million planned by September 2026. Despite relying solely on external borrowing for funding, earnings are projected to grow at 7% annually.
LSE:MONY Share price vs Value as at May 2026
Simply Wall St Value Rating: ★★★☆☆☆
Overview: BlueNord is an energy company focused on the exploration and production of oil and gas, with a market cap of approximately $1.42 billion.
Operations: BlueNord’s revenue model primarily revolves around generating income through its core business activities, with recent figures indicating a revenue of $1039.3 million as of the end of 2025. The company’s cost structure includes significant expenses related to the cost of goods sold (COGS), which amounted to $461.7 million in the same period, impacting overall profitability. Notably, BlueNord’s net income margin has experienced fluctuations, reaching 0.091% by the end of 2025, reflecting variations in operational efficiency and non-operating expenses over time.
PE: 17.6x
BlueNord, a smaller European player, recently reported Q1 2026 sales of US$317.6 million, up from US$226.6 million the previous year, yet faced a net loss of US$9.3 million. Their April production hit 43.6 mboepd, with Tyra hub contributing significantly at 24.4 mboepd. Insider confidence is evident through recent share purchases by key figures within the company over the past few months, hinting at potential optimism despite forecasted earnings declines and reliance on external funding sources for growth initiatives like their new bond issue aimed at refinancing existing debt and supporting corporate activities.
OB:BNOR Share price vs Value as at May 2026
Simply Wall St Value Rating: ★★★★★☆
Overview: Billerud is a Swedish company specializing in the production and supply of high-quality packaging materials and solutions, with a market capitalization of approximately SEK 22.65 billion.
Operations: Billerud’s revenue primarily comes from sales of its products, with recent figures showing a revenue of SEK 39.31 billion as of March 31, 2026. The company’s cost structure is heavily influenced by its Cost of Goods Sold (COGS), which amounted to SEK 21.07 billion in the same period. Notably, Billerud’s net profit margin has shown variability over time, with a recent figure at approximately 0.20%.
PE: 210.6x
Billerud, a smaller European firm, recently reported a challenging first quarter with sales dropping to SEK 9.8 billion from SEK 11.1 billion the previous year and a net loss of SEK 219 million compared to last year’s profit. Despite these figures, there’s insider confidence shown by recent share purchases, indicating potential optimism about future growth prospects. Earnings are projected to grow significantly at an annual rate of 86.7%, suggesting potential for recovery despite current financial hurdles and reliance on external borrowing for funding.
OM:BILL Share price vs Value as at May 2026
Where To Now?
Want To Explore Some Alternatives?
This article by Simply Wall St is general in nature. We provide commentary based on historical data and analyst forecasts only using an unbiased methodology and our articles are not intended to be financial advice. It does not constitute a recommendation to buy or sell any stock, and does not take account of your objectives, or your financial situation. We aim to bring you long-term focused analysis driven by fundamental data. Note that our analysis may not factor in the latest price-sensitive company announcements or qualitative material. Simply Wall St has no position in any stocks mentioned.
Companies discussed in this article include LSE:MONY OB:BNOR and OM:BILL.
StubHub (NYSE: STUB) was the ticket to stock market gains for many investors in April. Largely on the back of favorable legal developments in its industry, plus a tie-up with a top artificial intelligence (AI) developer, market players were eager to buy the company’s shares. Across the month, its price rose by almost 17%. Legal
The Middle Eastern stock markets have recently experienced volatility, with Gulf shares slipping due to geopolitical tensions affecting investor sentiment. Despite these challenges, the appeal of penny stocks remains significant for investors looking for growth opportunities at lower price points. Penny stocks, often representing smaller or newer companies, can offer a unique blend of value
London, UK, May 05, 2026 (GLOBE NEWSWIRE) — AiTradeBtc announced the launch of its enhanced AI trading application designed to support automated investing across cryptocurrency and stock markets. The platform combines AI-driven analytics, automated trading systems, and integrated portfolio management tools to help users navigate increasingly fast-paced financial markets. As global trading activity becomes more digital
Today’s Change (0.66%) $0.17 Current Price $25.84 Key Data Points Market Cap $36B Day’s Range $25.69 – $26.29 52wk Range $19.22 – $34.03 Volume 2.3M Avg Vol 26M Gross Margin 29.71% Dividend Yield 0.58% Carnival (CCL +0.66%), a global cruise operator, closed Tuesday at $25.77, up 0.39%. The stock edged higher despite industry-wide pressure and
Rhythm Pharmaceuticals (RYTM +7.86%) was a healthcare company perfectly in tune with investor goals on Tuesday. Shares of the commercial-stage biotech soared to close almost 8% higher in value, thanks to a very well-received quarterly earnings report. Imcivree for the win Rhythm, which rose to prominence thanks to its highly specialized weight-loss drug Imcivree, reported
A man looks at a screen showing global stock market information on the street in Tokyo, Japan. Chris McGrath | Getty Images South Korea’s Kospi hit another record Wednesday as Asia-Pacific markets opened higher, tracking Wall Street gains overnight after oil prices dropped and strong earnings lifted investor sentiment. Signaling diplomatic efforts for resolving the
As central banks in major economies hold interest rates steady amid geopolitical uncertainties, the Asian markets are navigating a complex landscape of currency fluctuations and evolving policy expectations. In this environment, identifying stocks that may be priced below their estimated value requires careful consideration of factors such as earnings resilience and sector-specific growth potential. Top
While it’s not a high-profile stock, Graphic Packaging Holdings (GPK +12.24%) was very much a popular one on the second trading day of the week. Encouraged by a double beat the company scored with its first-quarter results, market players snapped up its shares to propel them to a more than 12% gain on Tuesday. A
Today’s Change (23.53%) $4.21 Current Price $22.10 Key Data Points Market Cap $7.3B Day’s Range $17.65 – $22.17 52wk Range $2.88 – $25.52 Volume 63M Avg Vol 26M Gross Margin -6045.14% Cipher Mining (CIFR +23.53%), bitcoin and AI data center operator, closed Tuesday at $22.1, up 23.53%. The stock moved higher after Q1 results and
(Image credit: Justin Sullivan/Getty Images) Stocks bounced back Tuesday as market participants brushed off geopolitical worries and cheered falling oil prices. A round of well-received earnings reports and a rally in tech stocks also lifted sentiment, with two of the three main equity indexes ending the day with new record highs. The tech-heavy Nasdaq Composite
The premise makes enough sense. There was a time, in fact, when defensive sectors such as consumer staples and healthcare reliably outperformed cyclical growth industries — like technology — in challenging economic environments. Assuming we’re nearer the end of an expansion cycle than the beginning of one right now, you may be tempted to own
The highs in the stock market have sparked both elation and concern. Although investors love to see their investments growing in value, indicators like the Shiller P/E ratio are flirting with all-time highs. This sparks concerns that the market is gearing up for a bear market or possibly even a crash. Ultimately, we do not
New York, NY, May 05, 2026 (GLOBE NEWSWIRE) — Zurich,As financial markets continue to move at breakneck speed, a growing number of investors are embracing AI quant trading trading to sharpen execution speed and decision-making precision. Today, DdbuShen announces the expansion of its fully automated investing platform, introducing a strategy-led AI trading system built to
May 5, 2026, 11:25 a.m. ET For armchair investors and retirement savers, “diversification” has come to mean a lot more than buying both stocks and bonds. And a “diversified” portfolio, in the 2020s sense of the term, did really well in 2025. Morningstar estimates that a broadly diversified asset mix, comprising 11 investment classes, gained 18.3% in 2025.
The bond market is sending a new warning to investors: don’t expect any rate cuts soon. Loading audio narration… That was evident in the move in Treasury yields this week, which crept higher as markets weighed upside risks to inflation from the Iran war and raised their expectations that the Federal Reserve will keep interest
A big date many investors have likely circled is May 15, which is when current Fed Chair Jerome Powell’s term is set to end. While Kevin Warsh will take over and there appears to be little doubt about that, the bigger question is what will happen with interest rates, which may have a significant impact
No final decisions have been made, and the offering’s terms remain subject to change. Credit: JHVEPhoto / Shutterstock.com US auto parts maker Tenneco has enlisted banks to arrange a potential stock market listing, as it charts a course back to public markets after its 2022 privatisation. According to unnamed sources cited by Bloomberg, Apollo Global
This article was written by Follow Commodity Trading Adviser (CTA), member of National Futures Association. Professor of Finance, research on Global-macro issues. Editor-in-Chief, Journal of Corporate Accounting and Finance. Analyst’s Disclosure: I/we have no stock, option or similar derivative position in any of the companies mentioned, and no plans to initiate any such positions within
It’s been a history-filled year on Wall Street — and we still have eight months to go! In addition to the S&P 500 (^GSPC 0.41%) and Nasdaq Composite (^IXIC 0.19%) recently catapulting to fresh all-time highs, we’ll likely witness some of the largest initial public offerings (IPOs) ever on Wall Street. Artificial intelligence (AI) large
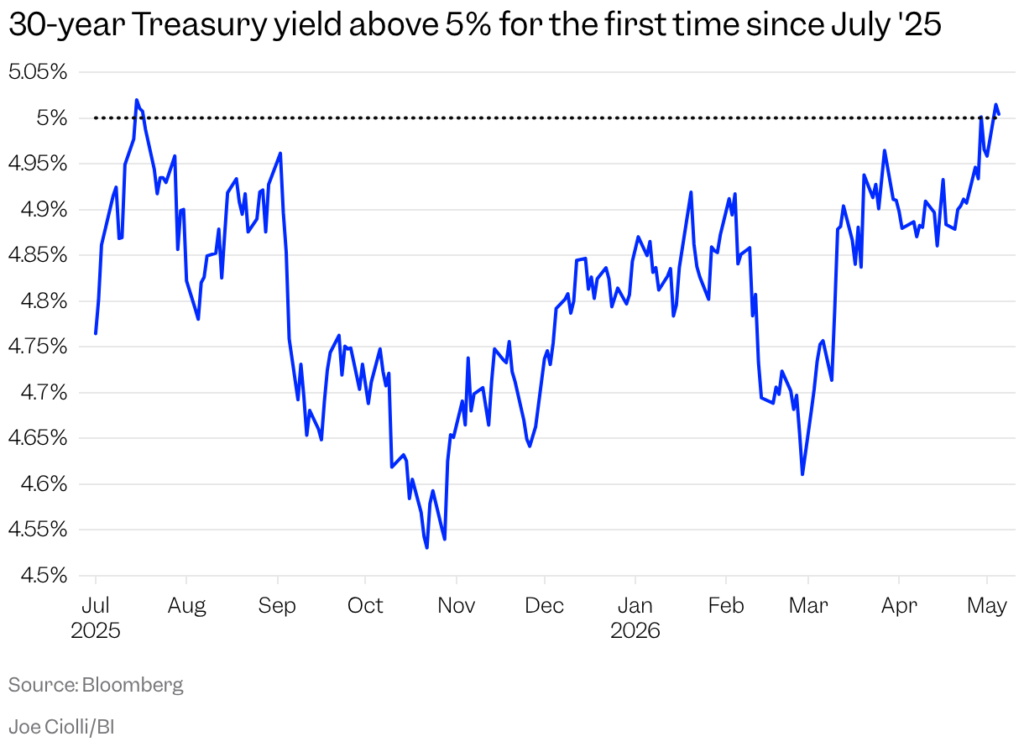
Uncle Sam’s longest-term debt is back above the stock market’s pain line. The US 30-year Treasury yield (^TYX) jumped 6 basis points Monday to 5.03%, its biggest one-day move since March 20 and its highest level since July 2025. That 5% zone has rattled stocks before. In last week’s Chart of the Day, the setup