Today’s Gold Analysis Overview:
-
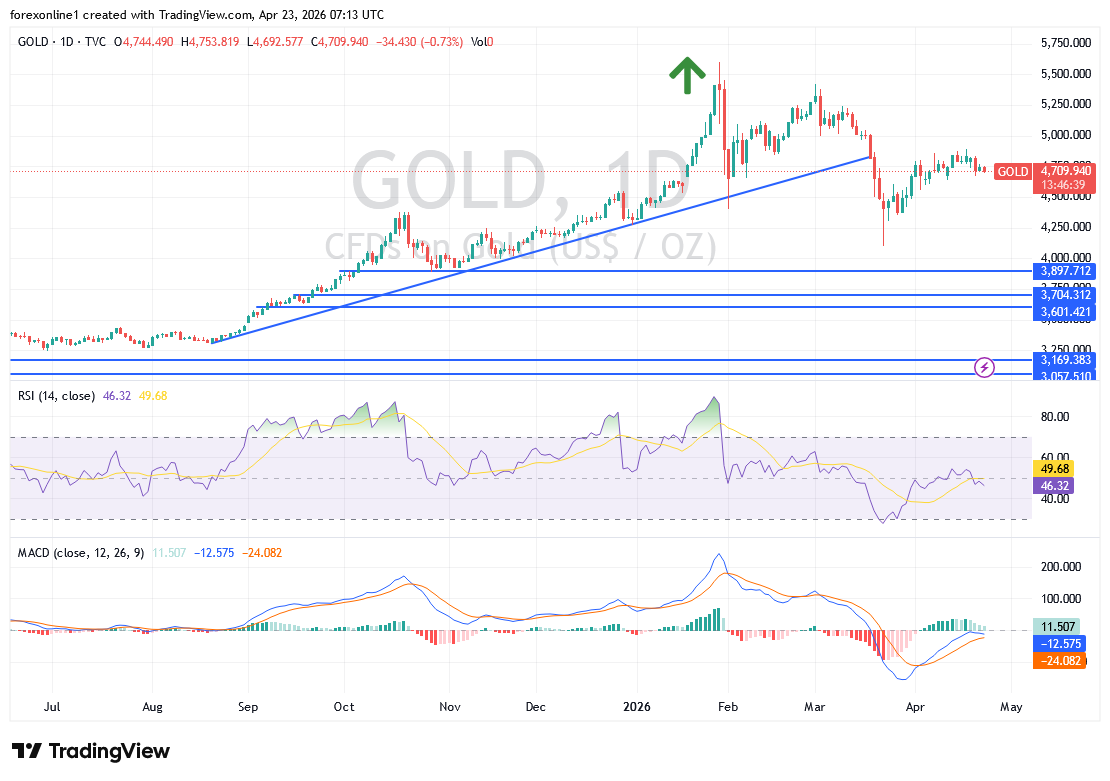
The Overall Gold Trend: Bearish.
-
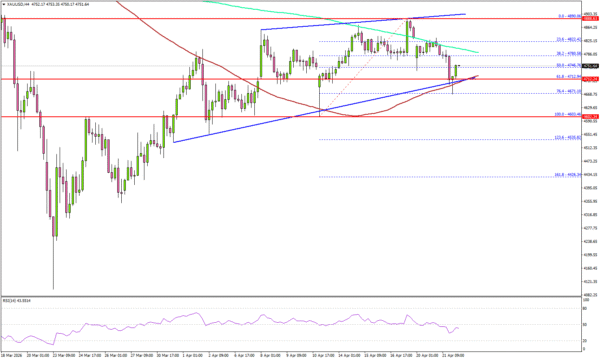
Today’s Gold Support Points: $4700 – $4640 – $4570 per ounce.
-
Today’s Gold Resistance Points: : $4775 – $4820 – $4885 per ounce.
Today’s Gold Trading Signals:
Note: These recommendations are suitable for medium-to-long-term traders, provided there is strict adherence to capital and risk management
Daily Technical Analysis of Gold/US Dollar (XAU/USD):
During yesterday’s trading session, gold futures rose by more than 1%, coinciding with a decline in oil prices after the US extended the ceasefire with Iran, easing inflation concerns. Across gold trading platforms, the price of the precious metal climbed to $4,772 per ounce before settling back down to around $4,738 per ounce, as the dollar’s gains halted gold’s upward rebound.
Based on recent performance, Trump’s extension of the ceasefire reduces the risk of immediate military escalation, thus mitigating the risk of inflationary oil price increases and putting pressure on the dollar. Generally, until a clearer path to a peace agreement emerges, gold trading is likely to remain in competition with the dollar for direction, resulting in price fluctuations within a defined range for the time being.
Gold Market Still Attracts Retail Inflows
Safe-haven demand remains the backdrop for this quarter’s performance. Gold prices surpassed $5,000 per ounce for the first time in January, peaking at $5,595 on January 29 before a sharp two-day correction saw it drop nearly $1,200.
In February, a Reuters poll of 30 analysts indicated that the average gold price forecast for 2026 would be $4,746.50—the highest consensus in the poll’s history since 2012. Major banks, including Goldman Sachs, JPMorgan, and Wells Fargo, expect gold to end the year between $5,400 and $6,300.
Bond Market Performance and Its Impact
Demand for U.S. Treasuries rebounded slightly, leading to lower yields as President Trump extended the ceasefire amid stalling peace talks. Simultaneously, U.S. stock futures and crude oil futures rose, with Brent crude nearing $100 per barrel.
The U.S. Dollar Index (DXY) stabilized as the confirmation hearing for Kevin Warsh, the nominee for Federal Reserve Chair, passed without major surprises. Markets continue to price in a “higher for longer” interest rate environment. The 10-year Treasury yield stood at 4.274% (down from 4.290%), while the 2-year yield fell to 3.766%.
The Bearish Scenario Gains Momentum
According to performance data, the 10-year Treasury yield fell to 4.274%, down from 4.290% yesterday. The 2-year Treasury yield also declined to 3.766% from 3.778%.
The scenario for a decline in the price of gold is gaining strength. Based on gold’s performance on the daily chart, the downward technical correction scenario is gaining momentum, and the $4665 and $4600 per ounce support levels will remain key targets for sellers in the coming period. This shift is supported by the 14-day Relative Strength Index (RSI) remaining below the neutral line, and the 100- and 200-day Simple Moving Averages (SMAs) also pointing towards further selling pressure.
Conversely, stabilizing above the $4,800 resistance level is essential for a neutral outlook and new buying opportunities.
Trading Advice
Dear TradersUp trader, it is best to consider selling gold on every upward retracement and avoid entering trades while prices are moving within very narrow ranges.
Ready to trade our Gold price forecast? We’ve made a list of the best Gold trading platforms worth trading with.


![U.S. dollar notes and Korean won at a branch of Hana Bank in central Seoul on April 3. [YONHAP]](https://charm-retirement.com/wp-content/uploads/2026/04/2cd924d3-b06f-4c09-aacf-4345ddd28f93-1024x683.jpg)