Nasdaq Breaks a New Record after Ceasefire Extension – Dow Jones and US Stock Market Outlook

  • US Stock Benchmarks corrected yesterday from a reappearing angst regarding the Ceasefire and Kevin Warsh’s hawkish hearing
  • Donald Trump saved the day by announcing yet another short-term extension to the Ceasefire
  • Exploring Technical Levels for the Dow Jones, Nasdaq and S&P 500

US stock benchmarks experienced a sharp correction yesterday, dragged down by reappearing angst over a collapsing US-Iran ceasefire and incoming Fed Chair Kevin Warsh’s hawkish Senate hearing.

However, President Trump quickly swooped in to save the day, announcing yet another short-term extension to the fragile truce.

While Trump has yet to set an official timeline for this new ceasefire extension, recent reports suggest that high-stakes talks with the Iranian delegation are now possible by Friday.

This crucial geopolitical lifeline allowed investors to aggressively buy the dip and erase the pain from yesterday’s selloff.

By doing so, buyers successfully voided the ominous double-top formation that was threatening the Nasdaq, sending the tech-heavy index skyrocketing back to fresh all-time highs – the S&P 500 is still threatened by its double-top however.

Technology continues to relentlessly lead the broader market.

The Nasdaq is currently outperforming all other global benchmarks as US bulls keep flexing their insatiable risk appetite.

This tech-lead rally is directly spilling over into the crypto space as well, with Bitcoin surging to new highs and closing in fast on the massive $80,000 milestone.

Expect volatility to remain elevated as markets eagerly await further confirmation regarding Friday’s potential diplomatic meetings and traders will have to see proper developments to maintain the current optimism.

Let’s dive into intraday charts and trading levels for the Dow Jones Industrial Average, Nasdaq Composite, and S&P 500.

Current Session’s Stock Heatmap

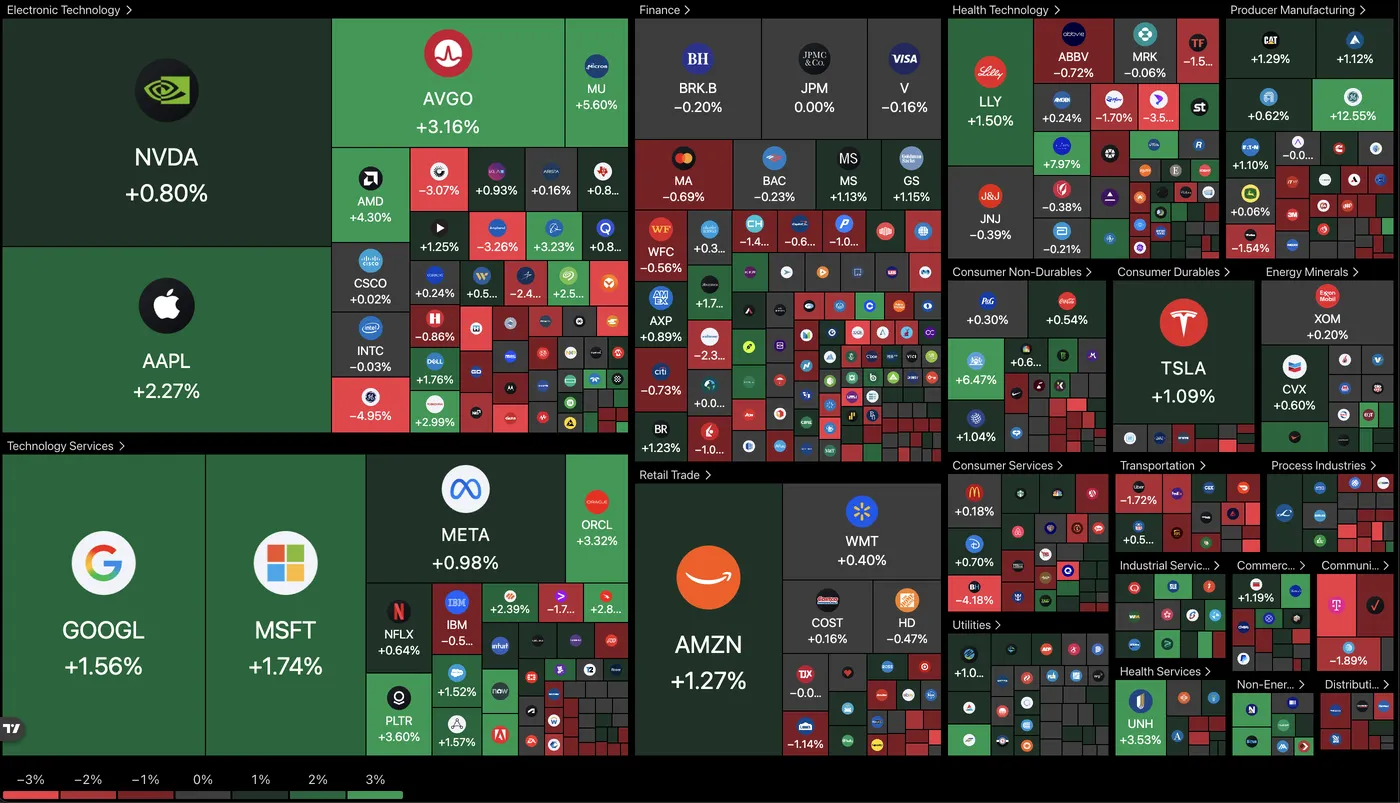
Current picture for the Stock Market (11:21) – Source: TradingView – April 22, 2026

The Stock Market is mostly green, but under some heavy sectorial inequality as investors still focus on local targeted plays, with a preference for value in the already high-cap Magnificent 7s, outperforming all other Stocks and helping to propel Nasdaq on top.

Dow Jones 2H Chart and Trading Levels

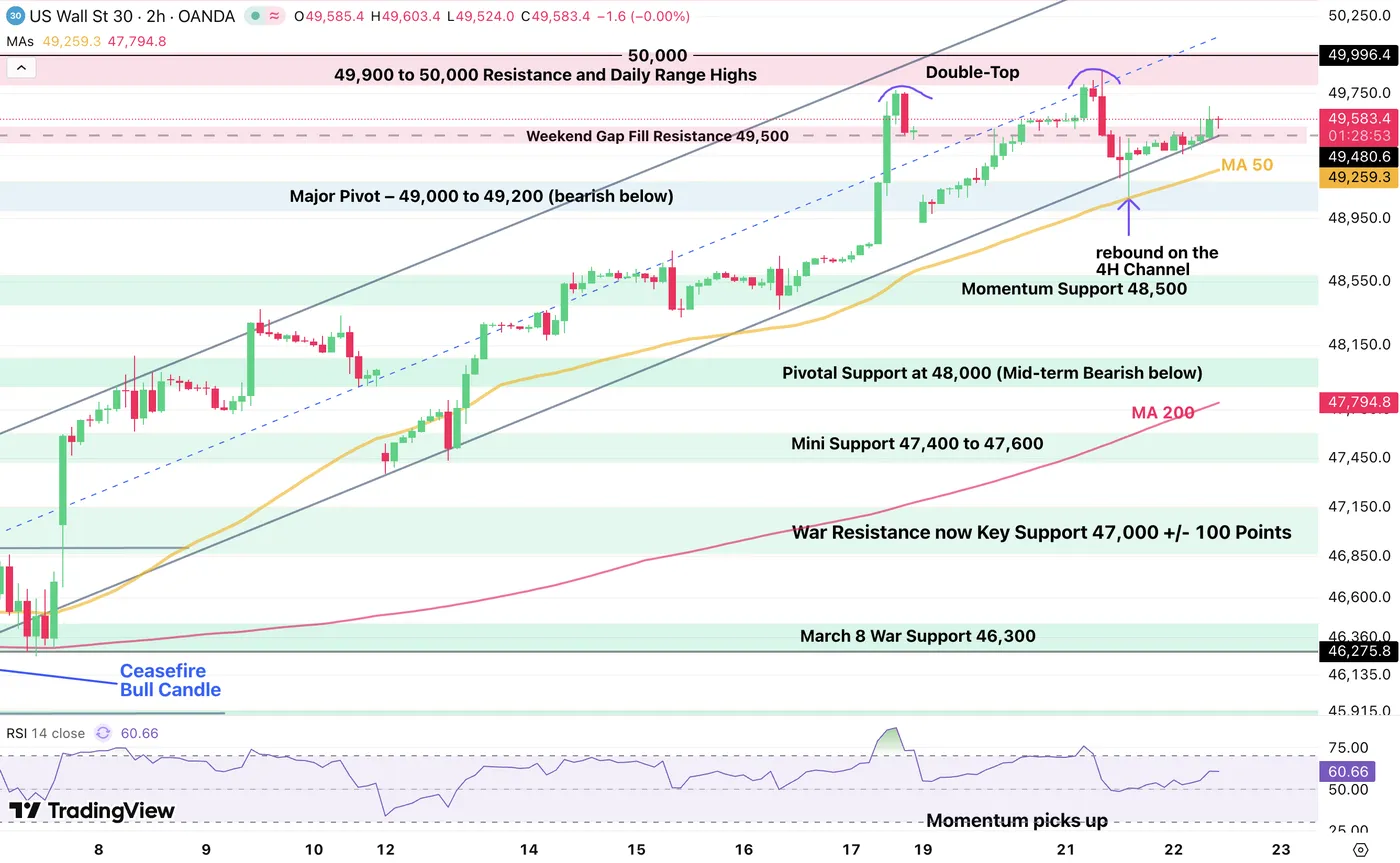
Dow Jones (CFD) 2H Chart – April 22, 2026 – Source: TradingView

The DJIA is slowly creeping higher but still lacks some conviction.

Bulls will want to see an extension above 49,600 to confirm a test of 50,000.

However, as long at the action remains above the 2H 50-period MA, bulls remain in control.

Dow Jones technical levels for trading:

Resistance Levels

  • Weekend Gap Fill Resistance 49,500 – 49,600 (testing)
  • 49,900 to 50,000 Resistance and Early 2026 Highs
  • All-Time Highs 50,544

Support Levels

  • 2H 50-period MA (49,300)
  • Major Pivot – 49,000 to 49,200 (short-term bearish below)
  • Momentum Support 48,500
  • Pivotal Support at 48,000 (Mid-term Bearish below)
  • Mini Support 47,400 to 47,600

Nasdaq 2H Chart and Trading Levels

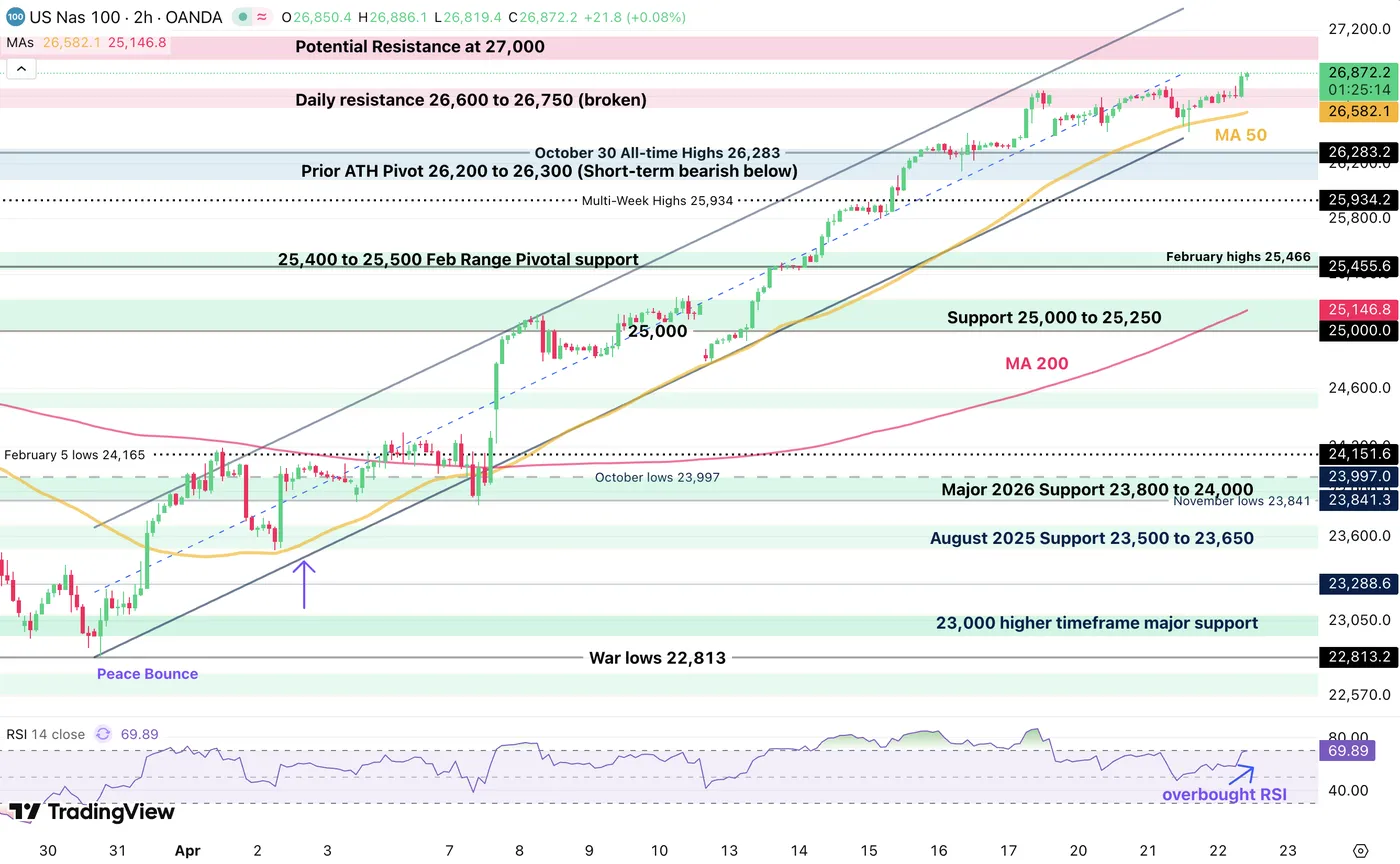
Nasdaq (CFD) 2H Chart – April 22, 2026 – Source: TradingView

Nasdaq is officially breaching some new all-time highs and running towards 27,000.

Momentum is stalling about 100 points to the psychological level with RSI reaching overbought conditions, so a newfound momentum will have to be found.

Still, the path of least resistance on the short-run is to the upside for the index.

  • The situation turns more bearish short-term if sellers bring back the action below 26,580 (2H 50-period MA)

Nasdaq technical levels of interest:

Resistance Levels

  • Daily resistance 26,600 to 26,750
  • New all-time highs 26,736
  • Potential Resistance at 27,000

Support Levels

  • 26,580 (2H 50-period MA)
  • Prior ATH Pivot 26,200 to 26,300 (Short-term bearish below)
  • 25,400 to 25,500 Feb Range Intraday Support
  • War Support 25,000 to 25,250
  • 24,450 to 24,550 Key Support
  • Early 2025 ATH at 22,000 to 22,229 Support

S&P 500 2H Chart and Trading Levels

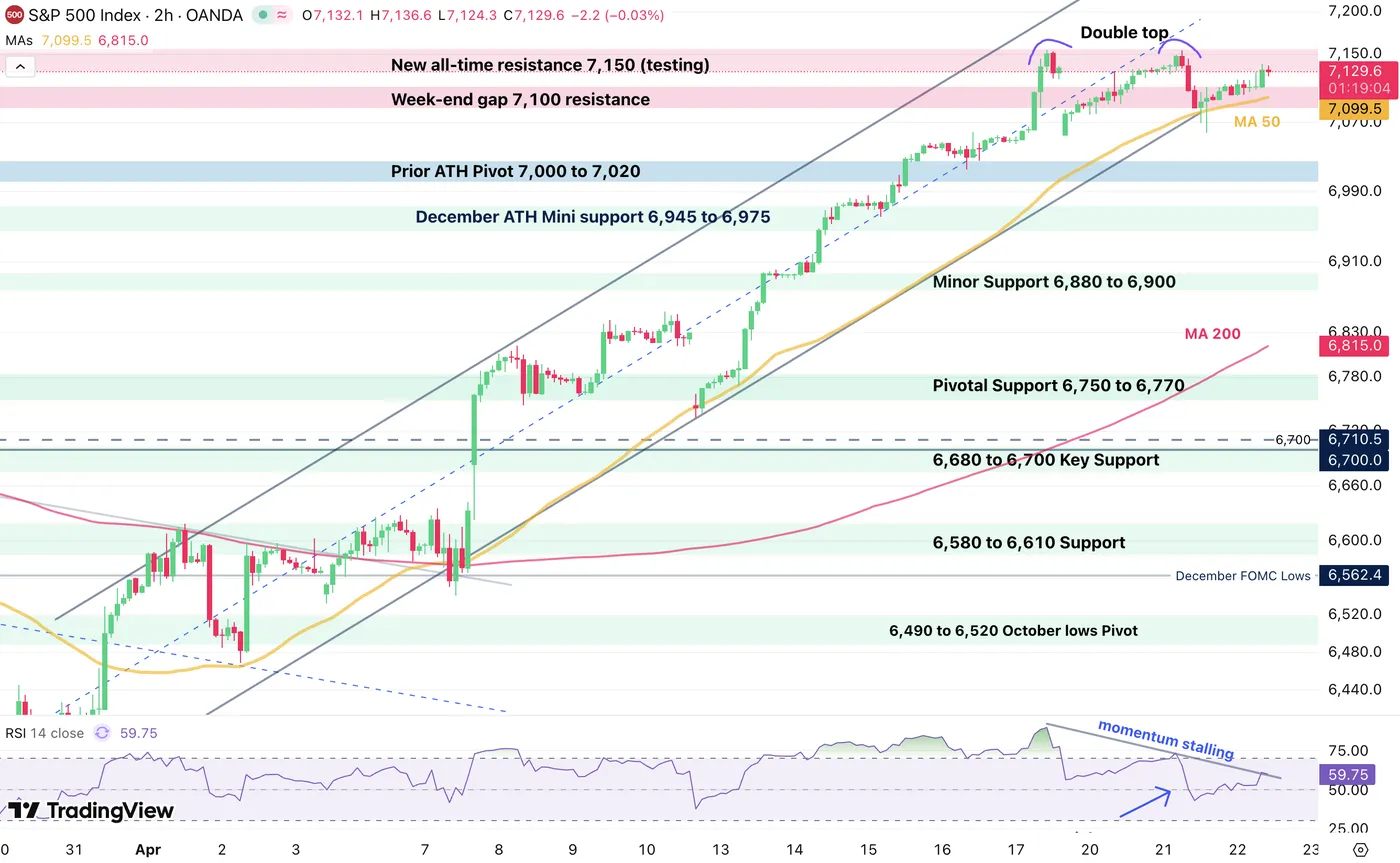
S&P 500 (CFD) 2H Chart – April 22, 2026 – Source: TradingView

The S&P 500 is attempting an extension to retest its all-time highs, but the momentum is not coinciding with a proper bullish price action.

The daily highs are at 7,138 and those will have to be surpassed in order to properly undo the Double top formation.

S&P 500 technical levels of interest:

Resistance Levels

  • Daily highs 7,138
  • New all-time resistance 7,150
  • Next key potential resistance 7,200

Support Levels

  • 7,100 psychological level and 2H 50-period MA
  • Prior ATH Pivot 7,000 to 7,020
  • December ATH Mini support 6,945 to 6,975
  • Minor Support 6,880 to 6,900
  • Pivotal Support 6,750 to 6,770
  • 6,680 to 6,700 Key Support
  • 6,300 psychological level (War lows)

Keep track of WTI Crude and the latest headlines throughout the week to stay ahead of the curve, with investors still confused about US-Iran negotiations.

Safe Trades!

Source link

Visited 1 times, 1 visit(s) today

Related Article

Robinhood gets in-principle approval to launch brokerage services in Singapore

Robinhood gets in-principle approval to launch brokerage services in Singapore

US neobroker Robinhood Markets Inc (NASDAQ:HOOD) has announced that in what it calls a milestone for its international expansion, the company has received in-principle approval (IPA) from the Monetary Authority of Singapore (MAS) to offer brokerage services. We had reported back in late 2024 that Robinhood was developing plans to open an APAC office headquartered in

EUR/GBP Daily Outlook - ActionForex

EUR/GBP Daily Outlook – ActionForex

Daily Pivots: (S1) 0.8657; (P) 0.8680; (R1) 0.8693; More… Intraday bias in EUR/GBP is back on the downside with break of 0.8675 support. Rebound from 0.8610 could have completed at 0.8740 already. Deeper fall would be seen back to retest 0.8610 low. On the paused, above 0.8692 minor resistance will turn intraday bias neutral again

Bitcoin Extends Gains, Can Bulls Drive A Larger Rally?

Bitcoin Extends Gains, Can Bulls Drive A Larger Rally?

Key Highlights Bitcoin started a fresh increase above $75,000 and $76,500. A bullish trend line is forming with support at $76,000 on the 4-hour chart of BTC/USD. Ethereum also climbed over 5% and surpassed $2,400. Gold is consolidating below the $4,850 resistance. Bitcoin Price Technical Analysis Bitcoin price remained supported above $74,000 against the US

EUR/CHF Daily Outlook - ActionForex

EUR/CHF Daily Outlook – ActionForex

Daily Pivots: (S1) 0.9157; (P) 0.9174; (R1) 0.9186; More…. Intraday bias in EUR/CHF remains neutral and range trading continues below 0.9264. Further rise is in favor with 0.9155 support intact. Firm break of 0.9264 will resume the rise from 0.8979 to 0.9394 resistance next. However, break of 0.9155 will turn bias back to the downside

gbpusd2204crispus.jpeg

Extremely Bullish Outlook Ahead of UK CPI Data (chart)

Created on April 22, 2026 Bullish view Bearish view The GBP/USD exchange rate wavered as market participants reacted to the latest UK jobs report and Kevin Warsh’s confirmation hearings in Washington. It was trading at 1.3510 on Wednesday as focus shifted to the upcoming UK inflation report. UK Consumer Inflation Report and Kevin Warsh Confirmation

usdsgd2204crispus.jpeg

On the Cusp of a Bearish Break (chart)

Created on April 22, 2026 The USD/SGD exchange rate has remained under pressure in the past few weeks as the US dollar has softened recently. It was trading at 1.2725 on Wednesday, down from the year-to-date high of 1.2925. Singapore Dollar Gains as the Greenback Slips The USD/SGD exchange rate has remained in a downward

xauusd-220426mahmoud.png

Bearish Bias Holds Below $4850

Created on April 22, 2026 Today’s Gold Analysis Overview: The Overall Gold Trend: Bearish. Today’s Gold Support Points: $4690 – $4630 – $4570 per ounce. Today’s Gold Resistance Points: $4780 – $4830 – $4885 per ounce. Today’s Gold Trading Signals: Note: These recommendations are suitable for medium-to-long-term traders, provided there is strict adherence to capital

USD/JPY Pulls Higher: Yen Doubts Bank of Japan

USD/JPY Pulls Higher: Yen Doubts Bank of Japan

USD/JPY climbed to 159.36 mid-week, with the Japanese yen losing ground for a second consecutive day. The market is pricing in the Bank of Japan’s policy outlook ahead of next week’s meeting. The regulator is likely to keep rates unchanged while continuing to analyse the impact of the Middle East conflict on the economy. At

Split Personality Markets: Stocks Up, Oil Warns, Dollar Torn

Split Personality Markets: Stocks Up, Oil Warns, Dollar Torn

Markets are showing a clear “split personality” right now. Equities are pushing higher on the back of the extended US–Iran ceasefire, while oil continues to signal caution and Dollar is caught between opposing forces. The result is a fragmented picture where no single macro narrative is dominating. US futures are trading higher after President Donald

Republicans are Indirectly Backing a Tougher Fed Policy

Republicans are Indirectly Backing a Tougher Fed Policy

Congress is in no hurry to confirm Warsh. US-Iran talks have broken down. The US dollar has launched a counter-offensive thanks to the breakdown of US-Iran talks and a 1.7% month-on-month rise in retail sales in March. The economy is strong, oil prices are high and could rise even further, whilst the futures market is

USD/JPY Daily Outlook - ActionForex

USD/JPY Daily Outlook – ActionForex

Daily Pivots: (S1) 158.80; (P) 159.28; (R1) 159.87; More… Intraday bias in USD/JPY stays neutral as consolidation continues below 160.45. Further rise is expected with 157.49 cluster support (38.2% retracement of 152.25 to 160.45 at 157.31) intact. On the upside break of 160.45 will target a retest on 161.94 high. However, firm break of 157.31/49

Gold and Silver Recover as US Extends Iran Ceasefire, But Technical Weakness Emerges

Gold and Silver Recover as US Extends Iran Ceasefire, But Technical Weakness Emerges

Gold and Silver stabilized after the US extended the Iran ceasefire, cushioning markets from immediate escalation fears and preventing a deeper selloff. The move offset earlier weakness triggered by the cancellation of JD Vance’s planned diplomatic trip. However, technical developments suggest both metals are becoming increasingly vulnerable to a near-term bearish reversal, with selling likely

Gold Stabilizes, Market Prepares For Next Decisive Move

Gold Stabilizes, Market Prepares For Next Decisive Move

Key Highlights Gold started a fresh increase above the $4,700 zone. A key contracting triangle is forming with resistance at $4,900 on the 4-hour chart. WTI Crude Oil tested $83.00 and recently recovered some losses. EUR/USD failed to stay above 1.1820 and corrected gains. Gold Price Technical Analysis Gold reclaimed the $4,550 pivot level and

14 cheated of Rs 2cr in forex trading lure; 3 of family booked

14 cheated of Rs 2cr in forex trading lure; 3 of family booked | Surat News

Surat: Three members of a family allegedly cheated at least 14 people of Rs 2.05 crore after luring them with promises of high returns from forex trading.Three accused members of a family, including a woman, allegedly cultivated trust among locals by frequently visiting a temple in Dabholi and projecting an image of wealth. They would

CHFJPY Achieves New Highs from Blue Box Zone

CHFJPY Achieves New Highs from Blue Box Zone

In this technical blog, we will look at the past performance of the 4-hour Elliott Wave Charts of CHFJPY. In which, the rally from September 2024 low is unfolding as an impulse sequence. Therefore, called for more upside to take place. We knew that the structure in the pair should remains incomplete & should see

Dollar Forecasting Tougher Times Ahead – EUR/USD, AUD/USD & Dollar Index (DXY) Overview

Dollar Forecasting Tougher Times Ahead – EUR/USD, AUD/USD & Dollar Index (DXY) Overview

The US Dollar has corrected quite severely since the announcement of the two-week ceasefire, and not without good cause. The infamous Petrodollar trade has gripped financial markets on all sides since the beginning of the US-Iran-Israel conflict, particularly amid the rise in Crude Oil to 4-year highs. The USD has historically held a decent correlation

xauusd-210426mahmoud.jpeg

Bearish Bias Ahead of Potential US-Iran Talks (chart)

Created on April 21, 2026 Today’s Gold Analysis Overview: The Overall Gold Trend: Neutral with a bearish bias. Today’s Gold Support Points: $4765 – $4720 – $4680 per ounce. Today’s Gold Resistance Points: $4830 – $4880 – $4925 per ounce. Today’s Gold Trading Signals: Note: These recommendations are suitable for medium-to-long-term traders, provided there is

US Retail Sales Surge 1.7% mom in March, Core Spending Signals Resilient Demand

US Retail Sales Surge 1.7% mom in March, Core Spending Signals Resilient Demand

US retail sales rose 1.7% mom to USD 752.1B in March, beating expectations of 1.3% mom and pointing to stronger-than-anticipated consumer demand. Ex-auto sales climbed 1.9% mom to USD 612.4B, also above forecasts of 1.3% mom. However, the composition shows a more nuanced picture. Sales excluding both autos and gasoline rose just 0.6% mom, indicating

0
Would love your thoughts, please comment.x
()
x