Until recently, the stock market appeared unstoppable. The dynamic Dow Jones Industrial Average (^DJI +0.63%), benchmark S&P 500 (^GSPC +1.02%), and artificial intelligence-inspired Nasdaq Composite (^IXIC +1.23%) had all reached record-closing highs since late October.
But mounting uncertainties have investors second-guessing the current bull market. Despite a mammoth rally in equities last week, one of Wall Street’s leading indicators is foreshadowing a bumpy ride to come for the Dow, S&P 500, and Nasdaq Composite.
Image source: Getty Images.
This hasn’t happened in 74 years
While the headline data release on Friday was the March inflation report, the argument can be made that another indicator stole the show: the University of Michigan Consumer Sentiment Index (MCSI).
The MCSI is a monthly survey of Americans across the contiguous 48 U.S. states that examines consumer confidence in three areas: personal finances, business conditions, and buying conditions. It’s essentially a measure of current consumer spending and an indicator of future spending activity.
On Friday, April 10, preliminary results for the Michigan Consumer Sentiment Index show it tumbled nearly 11% from the previous month to an all-time low of 47.6. Mind you, the MCSI has been reported on a fairly regular basis since 1952, and it’s never been lower than it is now.
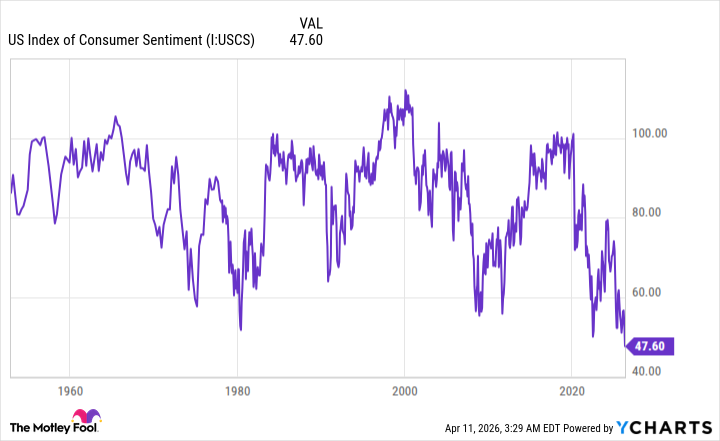
US Index of Consumer Sentiment data by YCharts.
The primary catalysts behind this significant drop-off in consumer sentiment are uncertainties tied to the Iran war and inflationary pressures (also stemming from the Iran war). The virtual closure of the Strait of Hormuz by Iran cut off about 20% of the world’s global liquid petroleum demand. In turn, crude oil prices have soared, resulting in the quickest increase in fuel prices in more than three decades.
Although spending on gas accounts for just 3.1% of the average American’s budget, according to research from The Motley Fool, this increase is hitting lower-income households harder and can put a serious dent in discretionary spending.

Image source: Getty Images.
A new low for the Michigan Consumer Sentiment Index implies heightened volatility for Wall Street
To preface the following discussion, the MCSI can’t guarantee what’s to come for the U.S. economy or the stock market. But in several instances over the last 74 years, it’s accurately forecast the future.
Historically, when the MCSI dips below 60, the U.S. economy falls into a recession. Although this wasn’t the case in 2011 or 2022, this arbitrary line in the sand has otherwise been accurate, dating back to 1952. When coupled with crude oil prices shooting above $100 — a level known to be a precursor to a recession — the puzzle pieces appear to be in place for the U.S. economy to weaken.
The US consumer sentiment index from the University of Michigan goes back to 1952.
It has never been lower than it is today. pic.twitter.com/ZG0Tz7k0p9
— Charlie Bilello (@charliebilello) April 10, 2026
More importantly, weak MCSI readings have strongly correlated with significant declines on Wall Street. The previous all-time low for the MCSI in 2022 coincided with a bear market that wiped away 25% from the S&P 500 and roughly a third from the Nasdaq Composite.
Other drops below 60 on the MCSI include the recession following the 1973 oil embargo by OPEC’s Arab nations, as well as the financial crisis of 2008-2009. The benchmark S&P 500 shed 45% and 49% of its respective value from these events.
An all-time low for the Michigan Consumer Sentiment Index bodes poorly for the stock market and suggests a significant move lower is imminent.