Metals Lost in Translation; Risk-Assets or Safe-Haven? – Silver (XAG/USD), Gold (XAU/USD) & Copper (XCU/USD) Outlook

  • Silver, Gold and the entire metals Market have been trading in confusion around US-Iran conflict and ceasefire news.
  • Struggling to find stable ground, Participants wonder if they are still true safe-havens.
  • Daily timeframe analysis for XAG/USD, XAU/USD and XCU/USD (Copper).

Metals have been an essential store of value and currency since the dawn of humanity.

Traditionally seen as safe havens, however, their price action has been nothing but confusing, even before the onset of the conflict.

Following the appointment of Kevin Warsh as head of the Federal Reserve, a massive wave of profit-taking triggered an unavoidable crash. They managed to retain a large part of their 2025 appreciation but haven’t found stable ground despite the evident appeal of safe havens.

Having stalled their corrections as geopolitical sentiment was starting to heat up (Greenland Crisis, Iran revolts leading to the War), the precious metals still could not muster the appeal to return to their January highs.

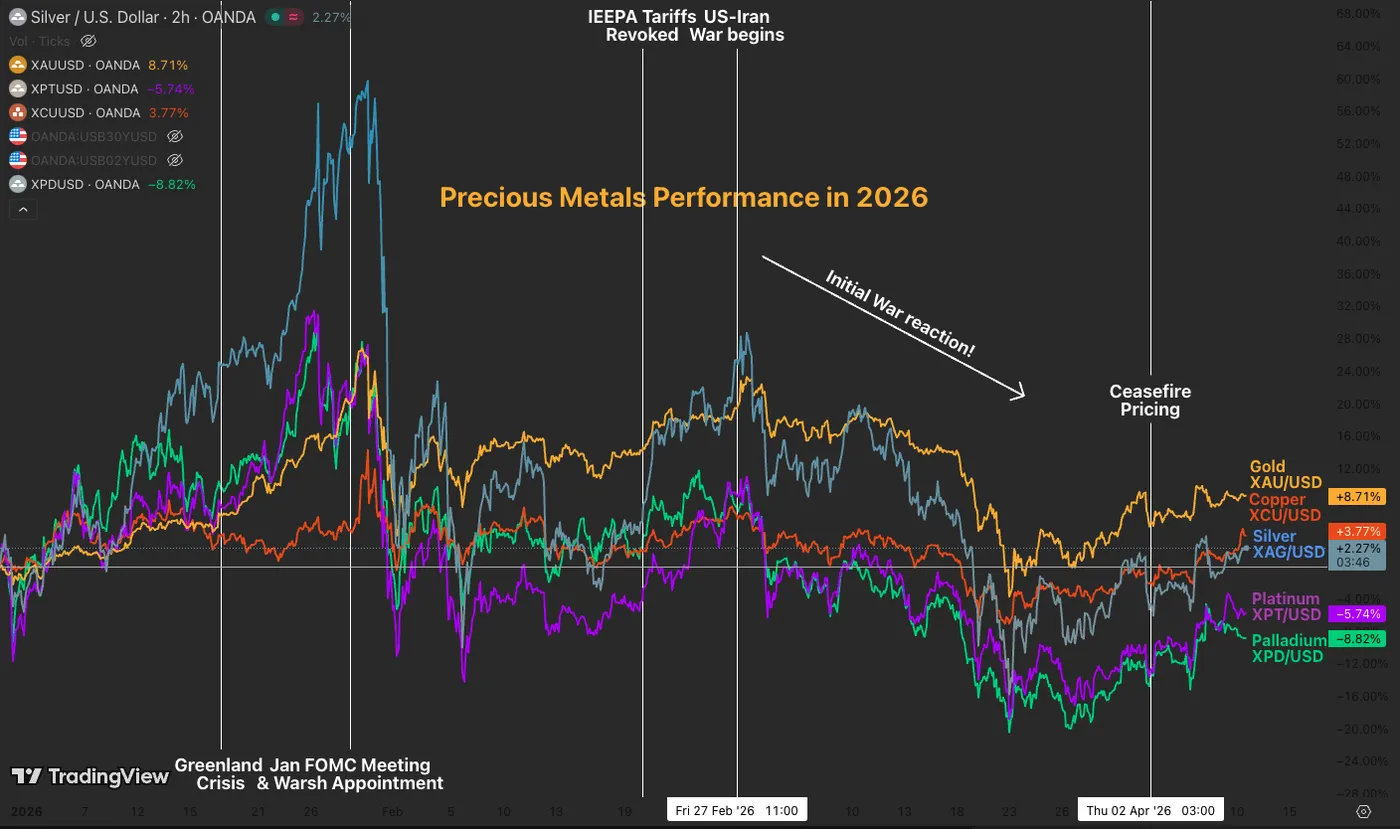
Metals performance in 2026 – Source: TradingView, April 10, 2026.

As you can see on the 2026 performance chart, metals reacted almost the opposite of what most Participants would have expected, particularly at the beginning of the War.

This dynamic continued with them only rebounding as rumors of a ceasefire and negotiations began, pointing to a new realization: Around current levels, Metals are now behaving like risk assets.

This reminds us that all asset classes and correlations move a certain way in “normal” Markets, but such historic trends can change brutally when:

  • Prices get extreme and/or
  • When volatility gets extreme (and Markets break).

Turning back to today, what will happen if the war actually ends? Will they continue going higher?

Why look for quite expensive safe havens if there are no more fundamental reasons to do so?

If they are really risk assets, they should keep bouncing, but buying discounted Stocks and Cryptos makes more sense for a risk-on trade.

Once again, these are million-dollar questions.

Let’s dive right into a Daily timeframe analysis of Gold (XAU/USD), Silver (XAG/USD), and Copper (XCU/USD) to see if technicals can tip the scales in favor of one side of the asset equation.

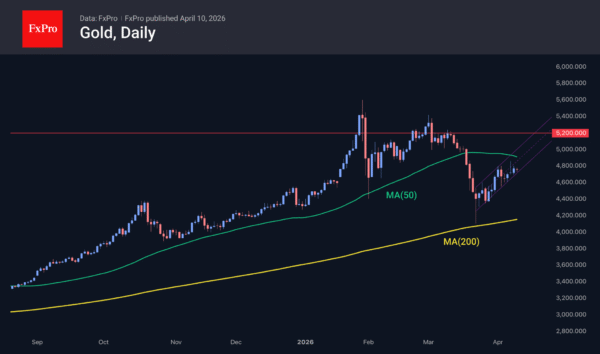
Gold (XAU/USD) Daily Chart and levels

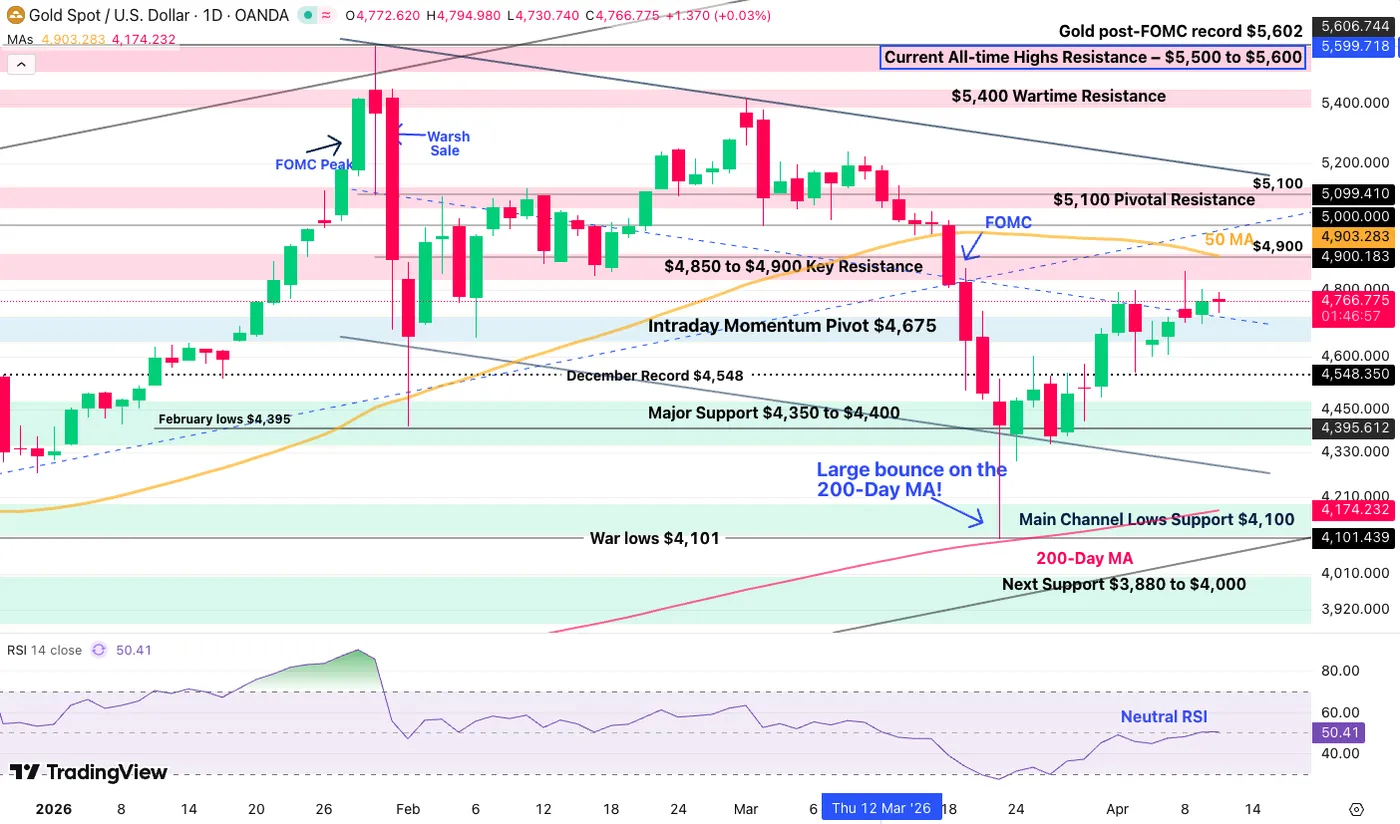
Gold (XAU/USD) Daily Chart, April 10, 2026 – Source: TradingView

Gold recovered strongly since reaching a catastrophic bottom two weeks ago, wicking at its 200-Day Moving Average (which remains a long-term barometer for bull-bear price action).

On the bigger picture however, the trend remains much weaker for the yellow metals, and while not as bearish anymore, struggling to breach $4,900 puts the action into a sideways consolidation until further news.

This gets confirmed with the neutral daily RSI.

Look for a range between $4,400 and $4,800 until breakout or breakdown follows. Nearing resistance, some short-term downside could be expected soon.

Higher Timeframe Levels to watch for Gold (XAU/USD):

Resistance Levels:

  • $4,850 to $4,900 Key Resistance
  • $5,100 Pivotal Resistance
  • $5,400 Wartime Resistance
  • Current All-time Highs – $5,500 to $5,600

Support Levels:

  • Intraday Momentum Pivot $4,675 (Short-term bearish below)
  • December Record $4,548
  • Pivotal Support $4,400 – Long-term Bearish below
  • $4,175 200-Day MA
  • Main Support $3,880 to $4,050
  • $3,200 to $3,500 Major Support

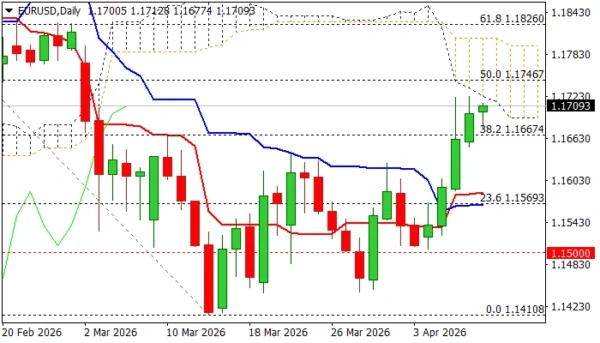
Silver (XAG/USD) Daily Chart and levels

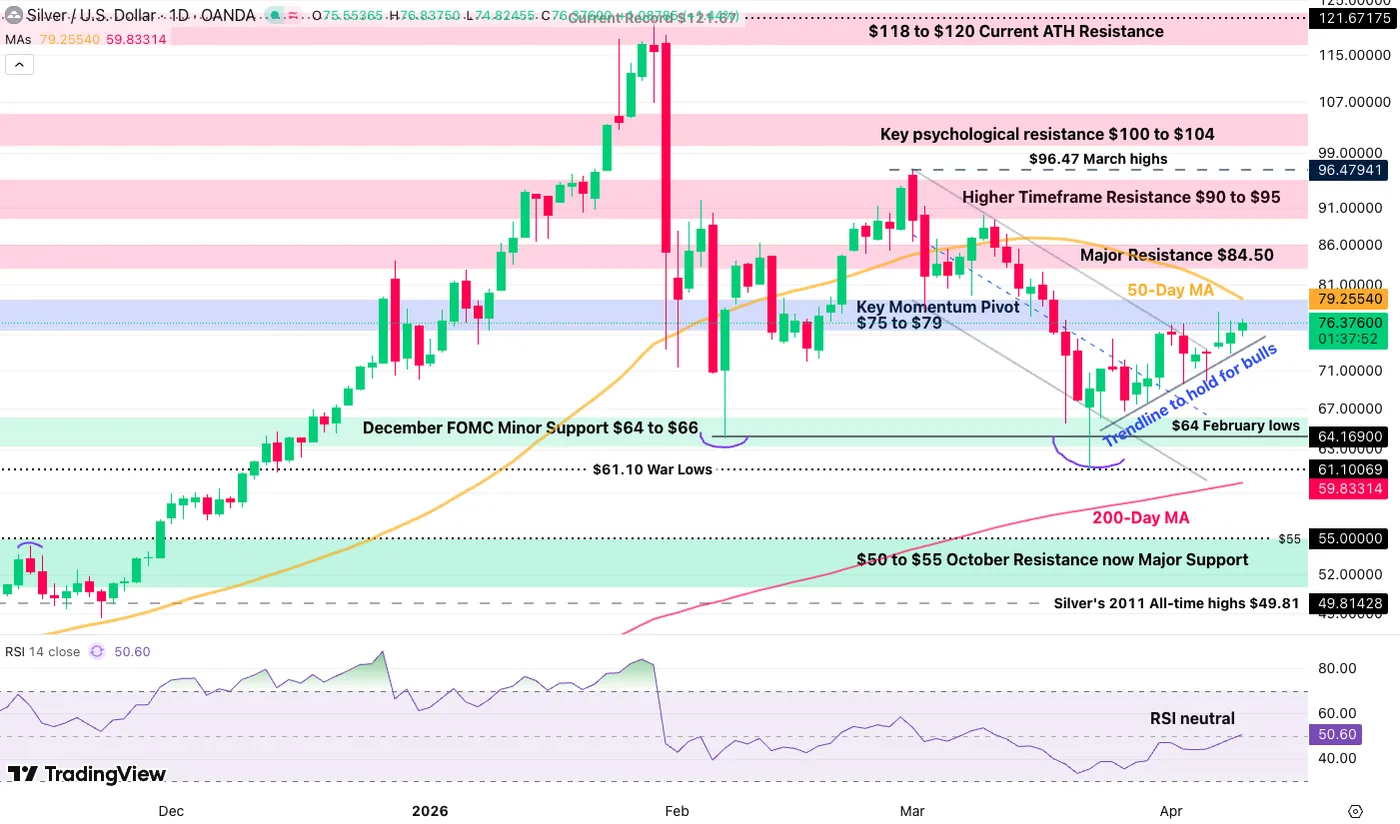
Silver (XAG/USD) Daily Chart, April 10, 2026 – Source: TradingView

Silver, more prone to risk, has been tracking better than its yellow peer.

Still, the precious metal is evolving within its Daily Pivot zone ($75 to $79) and will soon face a very essential test ahead: Its 50-Day Moving Average ($79)

  • Breaking it to the upside should see continuation back towards $84 at least
    • $90 may quickly follow if momentum gathers pace
  • Rejecting it however would point it back towards $64
    • More rangebound conditions could emerge for the long-run if it finds support there.

Higher Timeframe Levels to watch for Silver (XAG/USD):

Resistance Levels:

  • 50-Day Moving Average ($79)
  • Key Momentum Pivot $75 to $79
  • Major Resistance $84.50
  • Key psychological resistance $100 to $104
  • Current Record $121.67

Support Levels:

  • Weak support at trendline ($73.20)
  • Minor 2026 Support $70 to $72
  • December FOMC Minor Support $64 to $66
  • $50 to $55 October Resistance now Major Support

Copper (XCU/USD) Daily Chart and levels

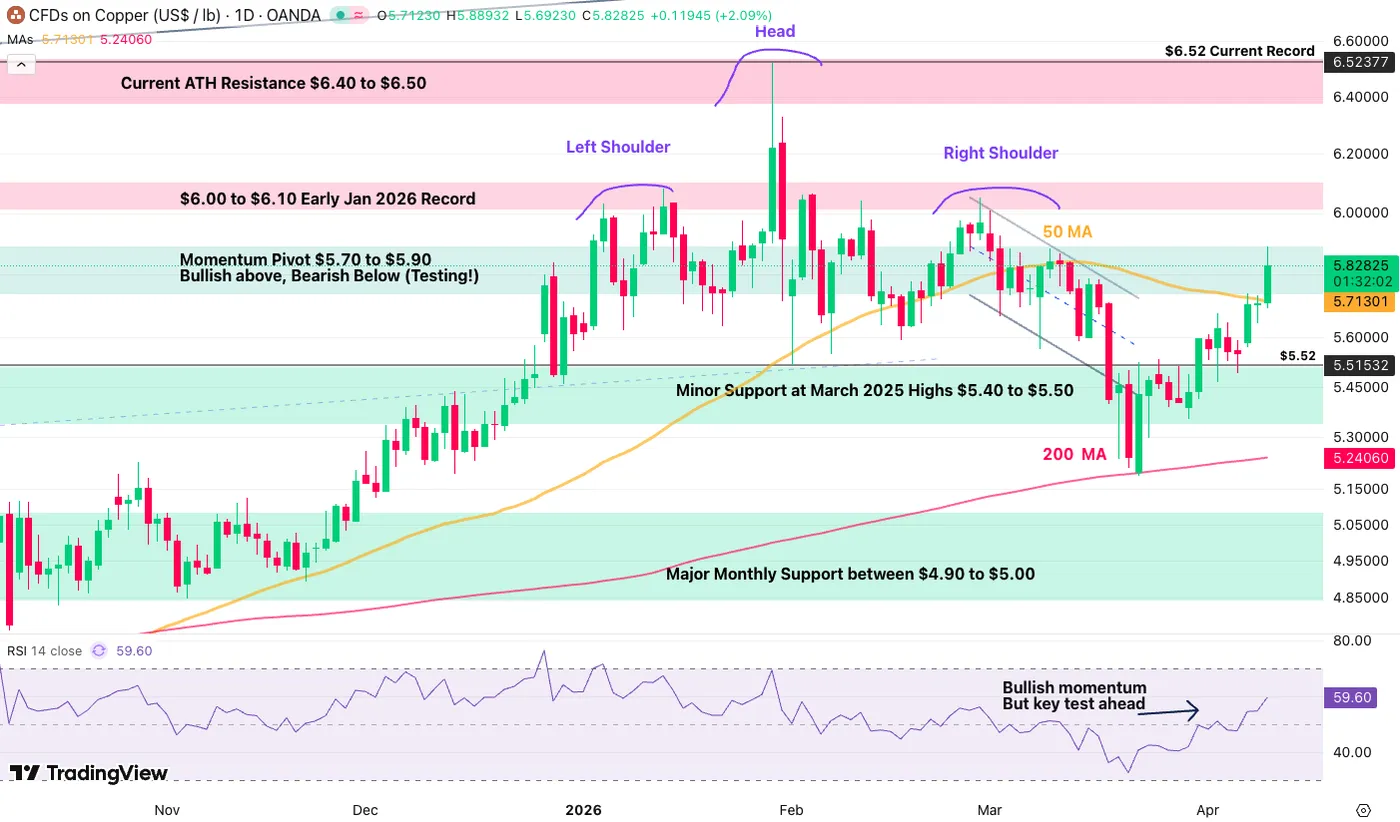
Copper (XCU/USD) Daily Chart, April 10, 2026 – Source: TradingView

Copper is the only metal that has managed to form a significant bounce after retesting its 200-Day MA just last week.

Bulls are still in control but will need to breach the key $5.90 level (top of daily pivot zone).

Failing to break it to the upside could see a retest of the $5.50 Support, into a more rangebound price action ahead.

Higher Timeframe Levels to watch for Copper (XCU/USD):

Resistance Levels:

  • $5.90 Major Momentum Pivot
  • $6.00 to $6.10 Early Jan 2026 Record
  • Current ATH Resistance $6.40 to $6.50
  • $6.52 Current Record
  • Potential Resistance $6.90 to $7.00

Support Levels:

  • Minor Support at March 2025 Highs $5.40 to $5.50
  • War lows $5.18
  • 200-Day MA $5.24
  • Major Monthly Support between $4.90 to $5.00

Keep closely track of the latest war headlines, but don’t fall in narrative traps as metals have now been moving on pure price action (and confusion).

Safe Trades!

Source link

Visited 1 times, 1 visit(s) today

Related Article

EUR/CHF Weekly Outlook - ActionForex

EUR/CHF Weekly Outlook – ActionForex

EUR/CHF stayed in sideway trading below 0.9264 last week and outlook is unchanged. Initial bias remains neutral first, and further rise is expected with 0.9155 support intact. Firm break of 0.9264 will resume the rebound from 0.8979 to 0.9394 resistance next. However, break of 0.9155 will turn bias back to the downside for deeper pullback.

EUR/AUD Weekly Outlook - ActionForex

EUR/AUD Weekly Outlook – ActionForex

EUR/AUD’s extended pullback last week suggests that rebound from 1.6125 has completed at 1.6842, after rejection by 55 D EMA (now at 1.6720). But as a temporary low as formed at 1.6497, initial bias is turned neutral this week first. On the downside, break of 1.6497 will target a retest on 1.6125 low. Nevertheless, firm

NYSE:DBD 1-Year Stock Price Chart

Diebold Nixdorf Index Additions And Nordic FOREX Deal Shift Valuation Context

Never miss an important update on your stock portfolio and cut through the noise. Over 7 million investors trust Simply Wall St to stay informed where it matters for FREE. Diebold Nixdorf (NYSE:DBD) has been added to the S&P SmallCap 600, S&P Composite 1500, S&P 1000, and S&P 600 Information Technology indices. The index changes

EUR/GBP Weekly Outlook - ActionForex

EUR/GBP Weekly Outlook – ActionForex

EUR/GBP stayed in range trading below 0.8740 last week and outlook is unchanged. Initial bias stays neutral this week first. Further rise is mildly in favor as long as 0.8675 support holds. Break of 0.8740 will resume the rebound from 0.8610 to 0.8788 resistance. However, firm break of 0.8675 will turn bias back to the

EUR/JPY Weekly Outlook - ActionForex

EUR/JPY Weekly Outlook – ActionForex

EUR/JPY’s strong rally last week and breach of 186.86 high suggests that long term up trend is resuming. Initial bias remains on the upside this week. Next near term target is 161.8% projection of 180.78 to 184.75 from 182.56 at 188.98. On the downside, below 185.88 minor support will turn intraday bias neutral first. But

USD/CAD Weekly Outlook - ActionForex

USD/CAD Weekly Outlook – ActionForex

USD/CAD’s pullback from 1.3965 extended lower last week but downside is contained above 38.2% retracement of 1.3840 to 1.3965 at 1.3780. Initial bias stays neutral and further rise remains in favor. On the upside, firm break of 1.3965 will resume the rise from 1.3480. However, sustained break of 1.3780 will argue that the rebound from

USD/CHF Weekly Outlook - ActionForex

USD/CHF Weekly Outlook – ActionForex

USD/CHF extended the pullback from 0.8041 short term top, but failed to sustain below 0.7877 cluster support (38.2% retracement of 0.7603 to 0.8041 at 0.7874). With 4H MACD crossed above signal line, initial bias is turned neutral first. On the downside, sustained trading below 0.7874/7 will argue that the rise from 0.7603 has completed, and

USD/JPY Weekly Outlook - ActionForex

USD/JPY Weekly Outlook – ActionForex

USD/JPY stayed in consolidations below 160.45 short term top last week and outlook is unchanged. Initial bias remains neutral first and further rise is expected with 157.49 cluster support (38.2% retracement of 152.25 to 160.45 at 157.31) intact. On the upside break of 160.45 will target a retest on 161.94 high. However, firm break of

EUR/USD Weekly Outlook - ActionForex

EUR/USD Weekly Outlook – ActionForex

EUR/USD’s extended rebound last week suggests that correction from 1.2081 has already completed at 1.1408. Initial bias stays on the upside this week for 61.8% retracement of 1.2081 to 1.1408 at 1.1824. Decisive break there will pave the way to retest 1.2081 high. On the downside, below 1.1642 minor support will turn intraday bias neutral

AUD/USD Weekly Report - ActionForex

AUD/USD Weekly Report – ActionForex

AUD/USD’s strong rebound last week suggests that pullback from 0.7187 has completed at 0.6832 already. Initial bias stays mildly on upside this week for retesting 0.7187. Strong resistance could be seen there to bring another fall to extend the near term corrective pattern. On the downside, below 0.7021 minor support will turn intraday bias neutral

Canada’s Auto Sector to Show Rebound Amid Mixed Home Resales

Canada’s Auto Sector to Show Rebound Amid Mixed Home Resales

It’s a relatively quiet week for Canadian data releases with attention focused on February’s manufacturing and wholesale trade reports on Wednesday. Advance estimates from Statistics Canada pointed to rebounds in both wholesale sales (excluding petroleum and agricultural products) up 2.3%, while manufacturing sales jumped 3.8% in February, supported by higher sales in the transportation subsector

Youtube preview

More to come? Crude pricing on Iran ceasefire talks [Video]

In today’s Market Outlook, let’s take a look at Forex Trading on NZDUSD, GBPUSD, Gold, XAUUSD, Silver, XAGUSD, Brent Crude Oil, WTI, the Nikkei225, the FTSE100, the DAX40, the NASDAQ, and the S&P500. From a technical point of view, we see all the US indices with inverted hammer and bullish engulfing candles, and we had

US CPI at 3.3% Misses Expectations, Second-Round Effects Still Limited

US CPI at 3.3% Misses Expectations, Second-Round Effects Still Limited

US inflation surged in March, with CPI rising 0.9% mom and lifting the annual rate from 2.4% yoy to 3.3% yoy. While the jump was significant, both figures came in slightly below expectations of 1.0% mom and 3.4% yoy respectively, suggesting the energy-driven spike was largely anticipated. The surge was overwhelmingly driven by energy costs.

Canada Employment Rebound 14.1k in March, Wage Growth Picks Up

Canada Employment Rebound 14.1k in March, Wage Growth Picks Up

Canada’s employment rose by 14.1k in March, slightly above expectations of 12.6k, offering a modest rebound after a cumulative decline of -109k over the first two months of the year. Despite the headline gain, both full-time and part-time employment showed little variation, suggesting underlying momentum remains limited. Labor market conditions were broadly stable. The unemployment

Gold: A Nice Recovery, But This is Already a Bear Market

Gold: A Nice Recovery, But This is Already a Bear Market

Gold has maintained a nice uptrend since the 23 March crash. However, the price spends a lot of time near the lower boundary of the channel and quickly rebounds from its upper boundary. The price is currently near the lower boundary at around $4,750, whilst the upper boundary stands at $5,000, a level we were

U.S. Dollar Pulls Back As Inflation Rate Jumps to 3.3%: Analysis For EUR/USD, GBP/USD, USD/CAD, USD/JPY

Subscribe To Notifications Scan QR code to install app Important DisclaimersFXEmpire is owned and operated by Empire Media Network LTD., Company Registration Number 514641786, registered at 7 Jabotinsky Road, Ramat Gan 5252007, Israel. The content provided on this website includes general news and publications, our personal analysis and opinions, and materials provided by third parties.

EUR/USD Weekly Price Analysis – Euro Rallies With Ceasefire And Rates

Subscribe To Notifications Scan QR code to install app Important DisclaimersFXEmpire is owned and operated by Empire Media Network LTD., Company Registration Number 514641786, registered at 7 Jabotinsky Road, Ramat Gan 5252007, Israel. The content provided on this website includes general news and publications, our personal analysis and opinions, and materials provided by third parties.

0
Would love your thoughts, please comment.x
()
x