- Mid-Week review where we dive into the major developments for North American and global Markets
- Yesterday evening, a two-week ceasefire was reached and Markets have exploded, easing their war premiums and discounts
- Crude Oil has now broken $100 and allowing Stocks and other assets to rally, at the cost of the Petrodollar
Log in to our mid-week North American Markets overview, where we examine current themes in North America and provide an overview of index and currency performance.
Markets have taken a huge turn after what could have been a disastrous escalation in the Middle East.
The Market had been preparing for the possibility of a less intense conflict in the region following the commencement of US-Iran talks on March 23rd. Communications in wartime is a foggy terrain, as enemies attempt to deceive each other and reassure their citizens, but the reality is often far less clear.
As the legendary portfolio manager Michael Burry said yesterday (post deleted), by issuing threats of “the end of a civilization” and other big words, the US President was preparing the terrain for a massive TACO.
When markets rally into the close as the situation gradually clears, it signals that someone likely knows something (as yesterday’s explosion showed).
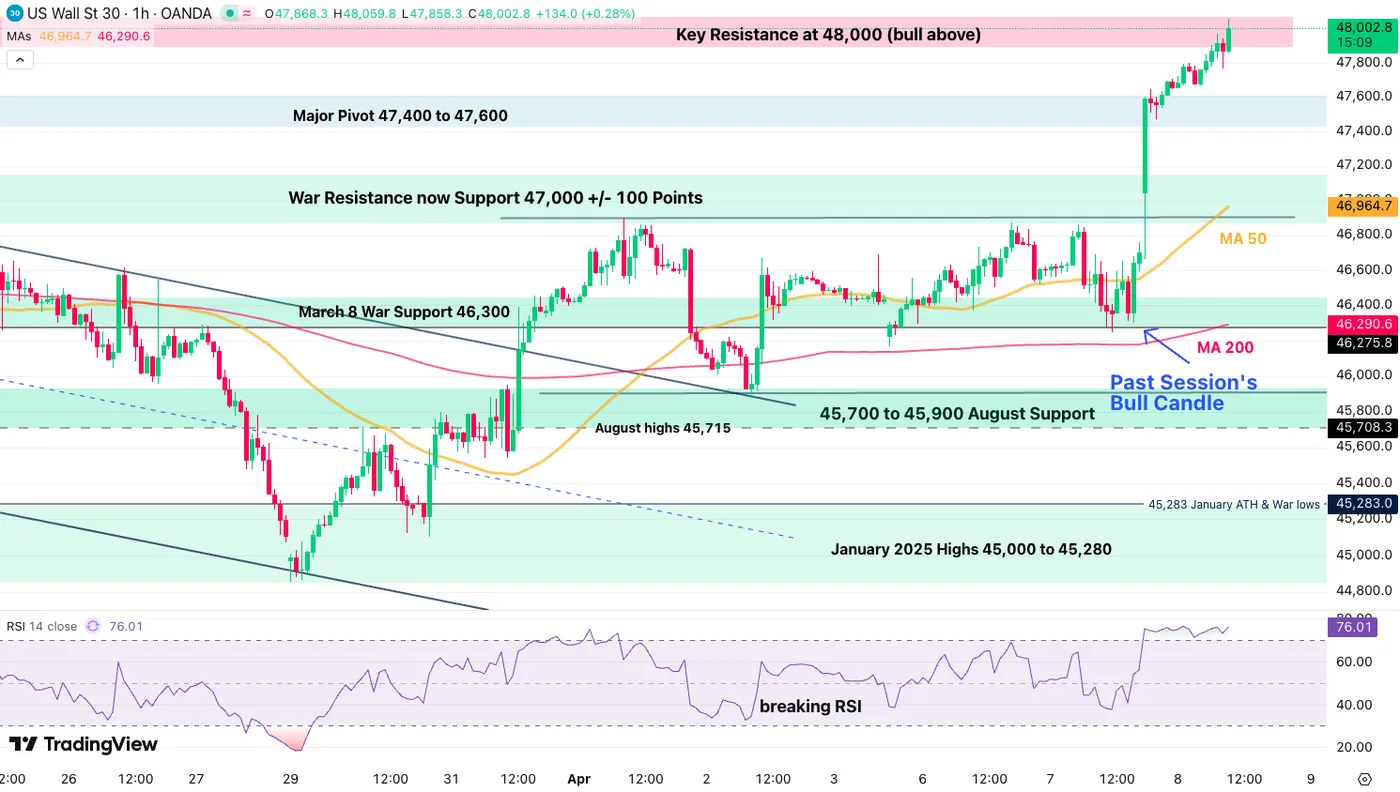
Dow Jones 1H Chart. April 8, 2026 – Source: TradingView
(An in-depth Stock Market outlook is coming up around the mid-session)
Luckily, it is a very positive factor for the World, which is positively affecting Markets; the conflict is officially stopping for at least two weeks and could lead to a longer-term peace prospect if both sides respect their commitments.
As always in ceasefire deals, some points will remain contentious, and the situation remains a bit unclear. If we were to listen to President Trump, most of the points from the 15-point draft have been accepted.
I invite you to pay close attention to the details to know more about whether the ceasefire is to be breached.
In any case, the asset that was the first and the most affected by the news is Crude Oil, naturally, with a gigantic 20% tumble that came right after the news and keeps extending.
The commodity is now trading below $95 a barrel and looks to continue correcting (at least hopefully). After 6 weeks of severely restricted passage through the Strait of Hormuz, many Asian and European countries faced oil shortages and droughts.
So this couldn’t have come at a better time.
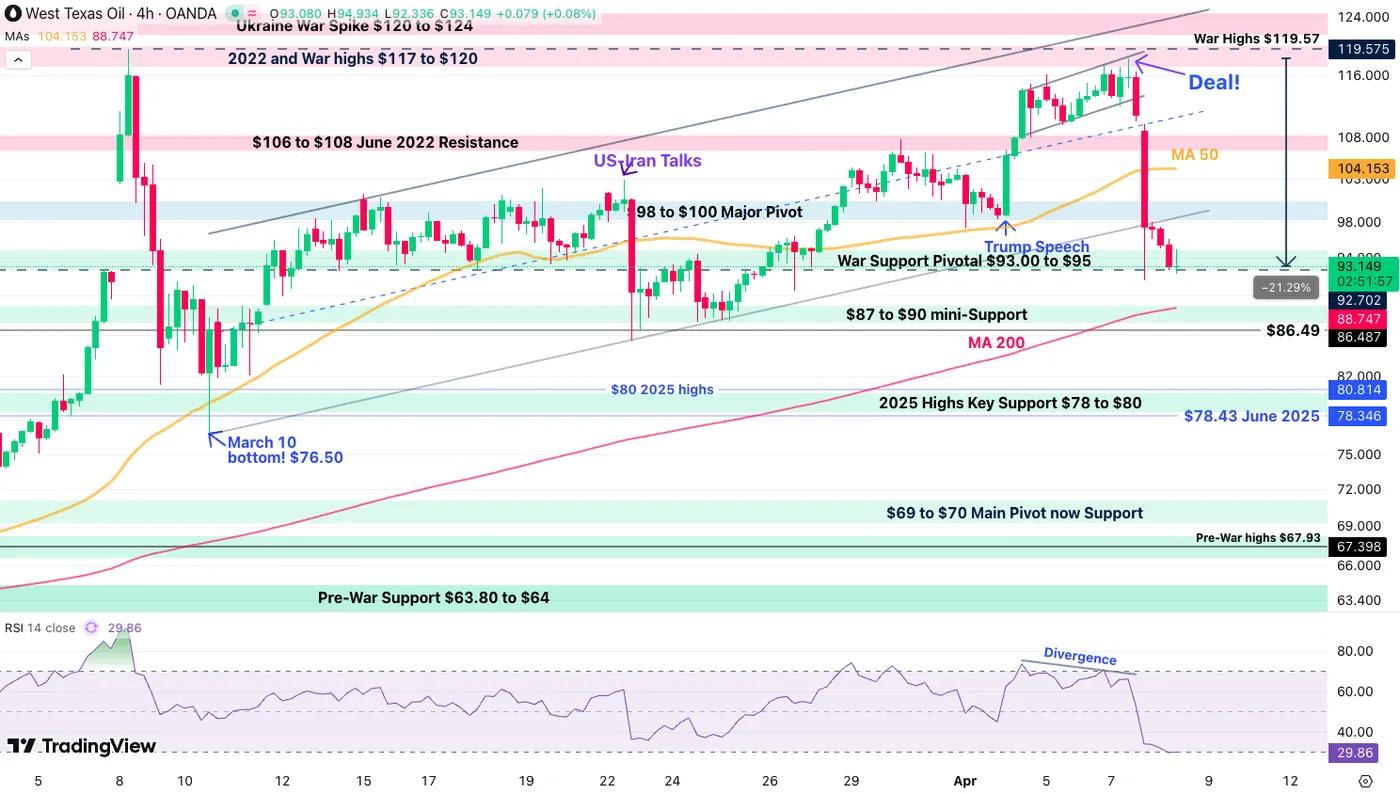
Oil 4H Chart. April 8, 2026 – Source: TradingView
North American Markets have just opened and to say that Wall Street is in ecstasy is nothing short of an understatement.
Nasdaq is leading US Indexes with a +3% extension from its Tuesday close and its peers are not shy if similar performances.
With the US Dollar getting battered by the lower Crude prices and easier Market sentiment, Let’s dive right into our Mid-Week North American Markets recap.
North-American Indices Performance
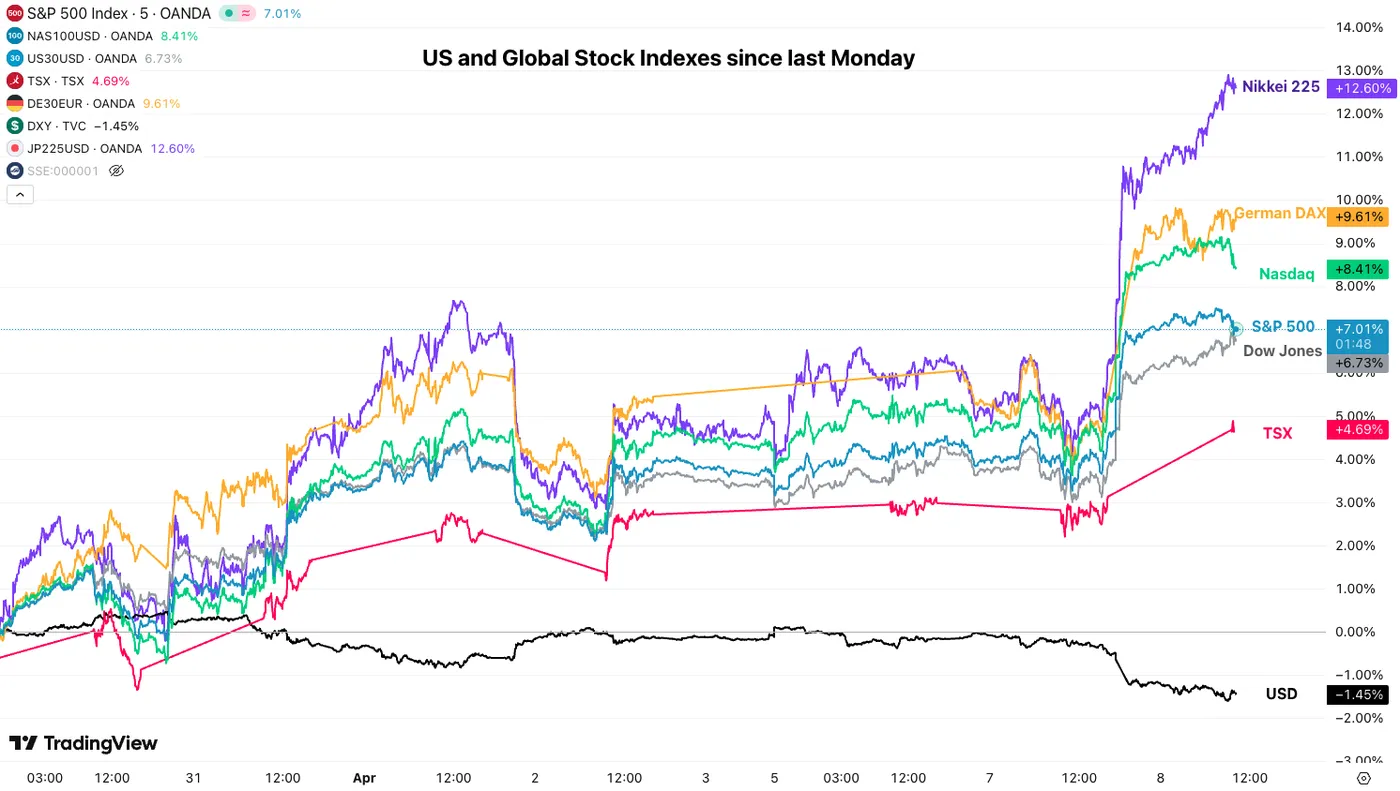
North American Top Indices performance since last Monday – April 8, 2026 – Source: TradingView
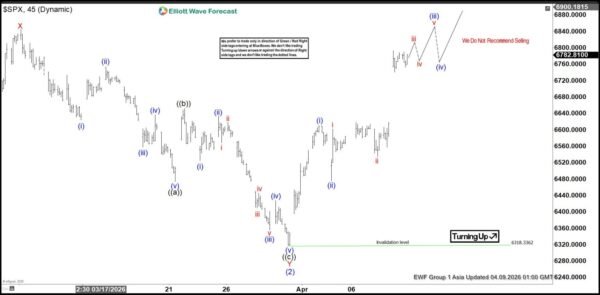
Global Equities have just erased 28 days of corrections in only one day, leading to what could be annual gains in this morning’s recovery session.
This is quite a stellar turn of events – This could leave fragile expectations if the situation was to sour for any reason, but at least, for now, Bulls are back in fury.
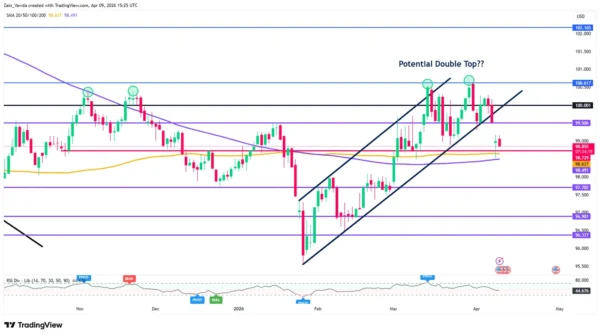
Dollar Index 4H Chart
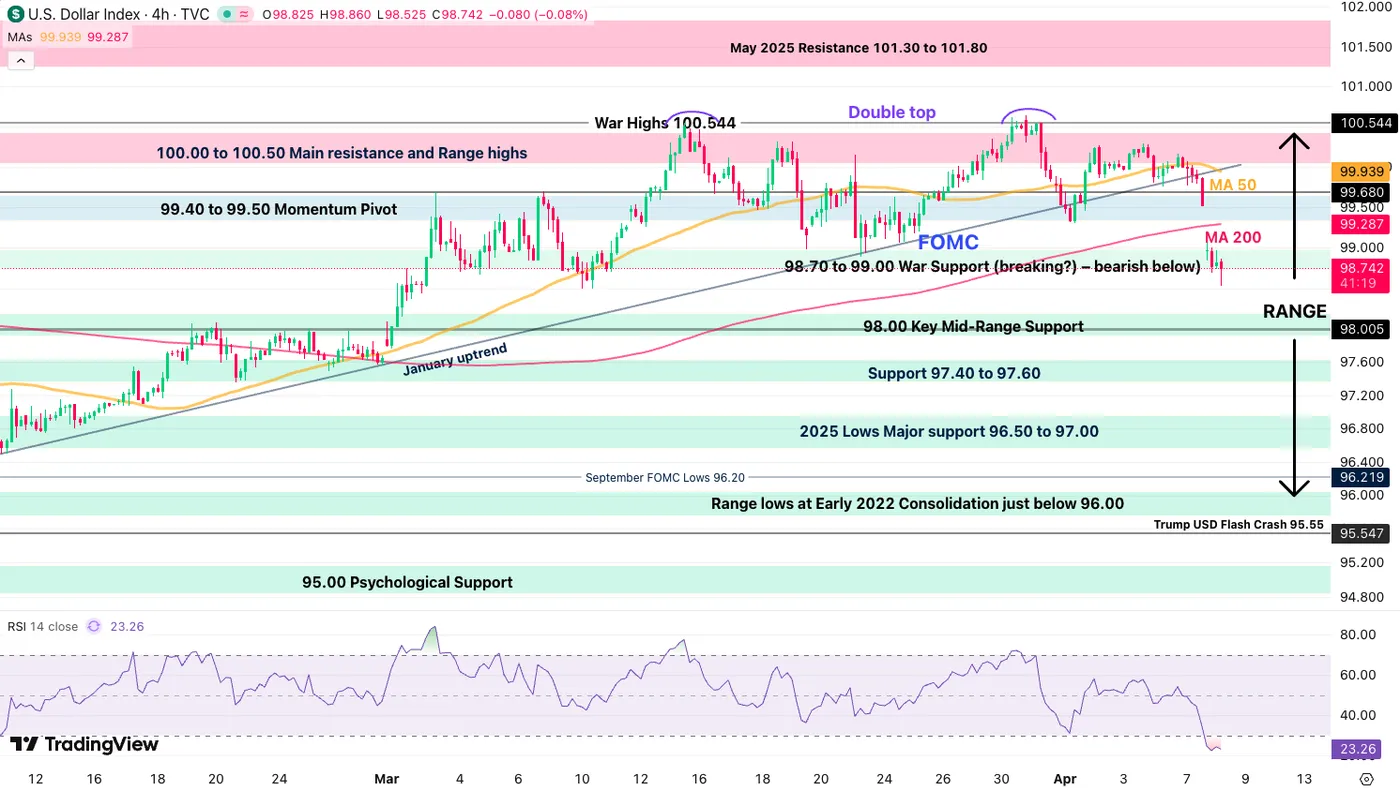
Dollar Index 4H Chart, April 8, 2026 – Source: TradingView
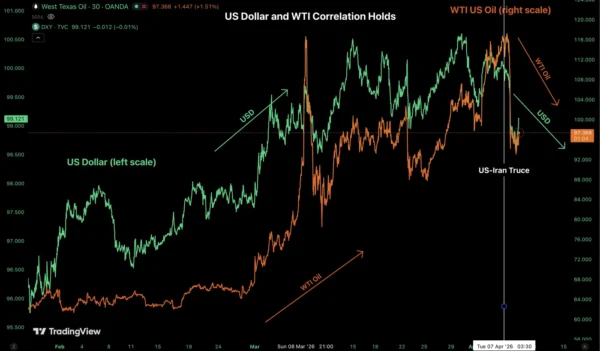
The Dollar Index double top really materialized into a gigantic drop, which will have its own effect on individual FX pairs – Keep closely track of WTI and Brent prices, as their drops should see an almost 1 to 1 effect on the USD.
To take advantage of this situation, check out individual pairs and look for trades that follow this Oil-USD correlation. An in-depth look at the Dollar will be addressed later today.
Levels to place on your DXY charts:
Resistance Levels
- 99.40 to 99.50 Momentum Pivot
- 100.00 to 100.50 Main resistance and Range highs
- War Highs 100.544 (Double Top)
- May 2025 Resistance 101.30 to 101.80
Support Levels
- 98.70 to 99.00 War Support (breaking?) – bearish below
- 98.00 Key Mid-Range Support
- Support 97.40 to 97.60
- 2025 Lows Major support 96.50 to 97.00
US Dollar Mid-Week Performance vs Majors
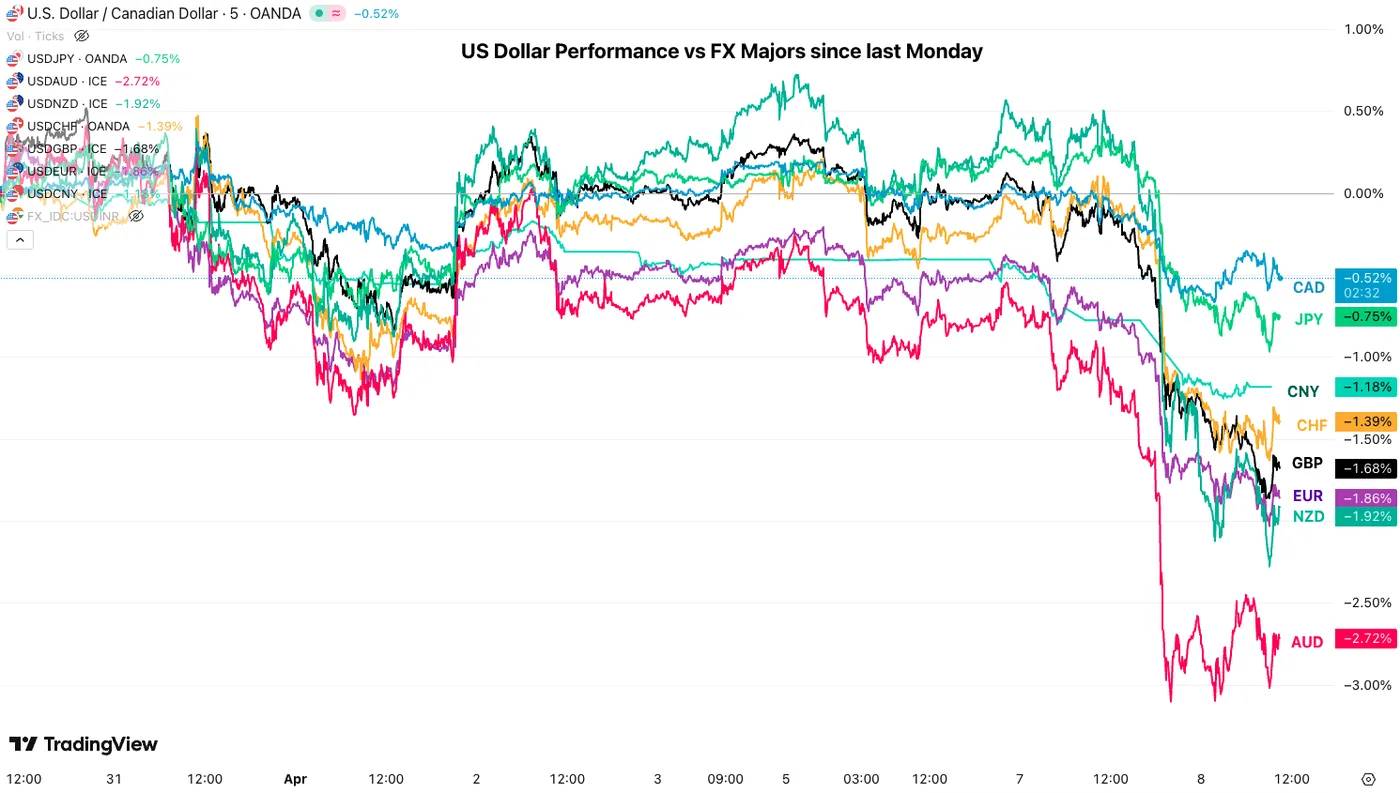
USD vs other Majors since last Monday, April 8, 2026 – Source: TradingView
The US Dollar has given up about 50% of its gains against its FX peers since the beginning of the war (and the move has accelerated).
After the gigantic overnight drops, some mean-reversion is ongoing which could offer opportunities.
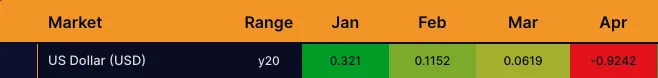
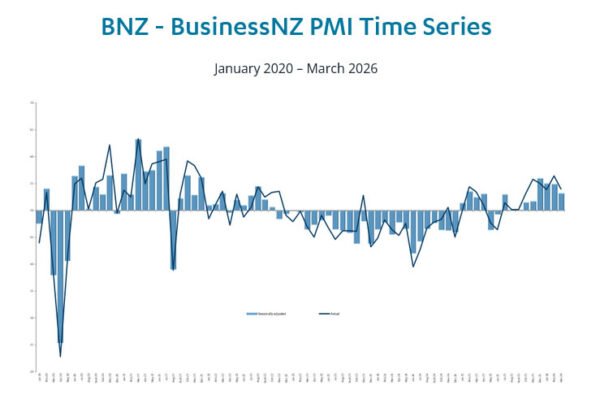
US Dollar Seasonal performance throughout the first quarter – Source: Market-Bulls.com
For those who haven’t seen our past week’s edition, this is a seasonal performance chart for the US Dollar. April is its weakest month of the year, so that itself could weigh even more on the Greenback.
Canadian Dollar Mid-Week Performance vs Majors
CAD vs other Majors, April 8, 2026 – Source: TradingView.
The Canadian Dollar has also given up a large part of its gains against its FX peers with WTI easing and better geopolitical prospects.
Holding slightly better against Europeans relative to the US Dollar, as long as Oil corrects, the CAD may still be under pressure in coming days.
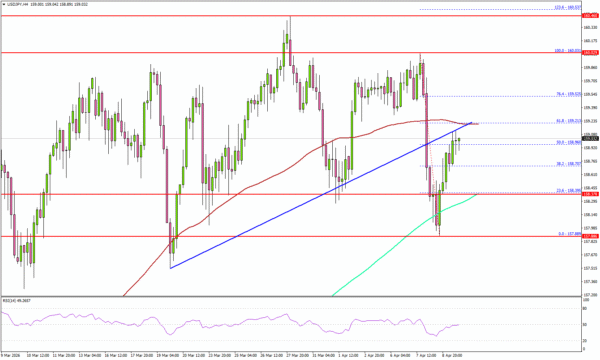
Intraday Technical Levels for the USD/CAD
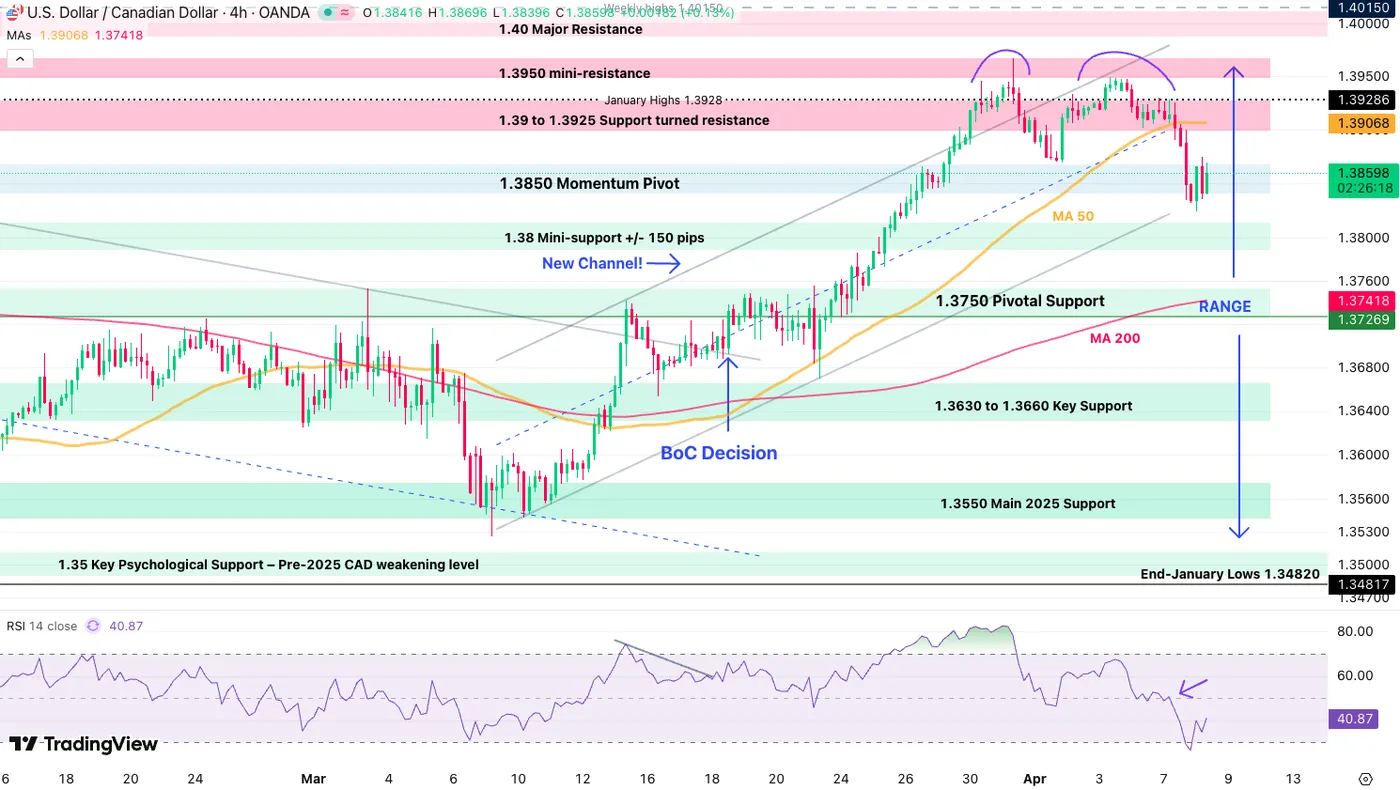
USD/CAD 4H Chart, April 8, 2026 – Source: TradingView
Despite its relative weakness against FX majors, the Loonie is at least outperforming the US Dollar in the recent Market turn.
Forming a double top at the extremes of its 1.3550 – 1.3950 large range, the North-American pair has space to correct.
On the immediate outlook, a pullback from oversold levels seems to be forming – Look at the 4H 50-period MA (1.39) which would provide optimal entries if prices get there.
Levels of interest for USD/CAD:
Resistance Levels
- 4H 50-period MA (1.39)
- 1.39 to 1.3925 Support turned resistance
- 1.3950 mini-resistance (Range highs and double top)
- 1.40 Major Resistance
Support Levels
- 1.3850 Momentum Pivot (testing)
- 1.38 Mini-support +/- 150 pips
- 1.3750 Pivotal Support
- 1.3630 to 1.3660 Key Support
- 1.3550 Main 2025 Support (Range Lows)
- October 2024 Support 1.3450 to 1.35
US and Canada Economic Calendar to next Wednesday
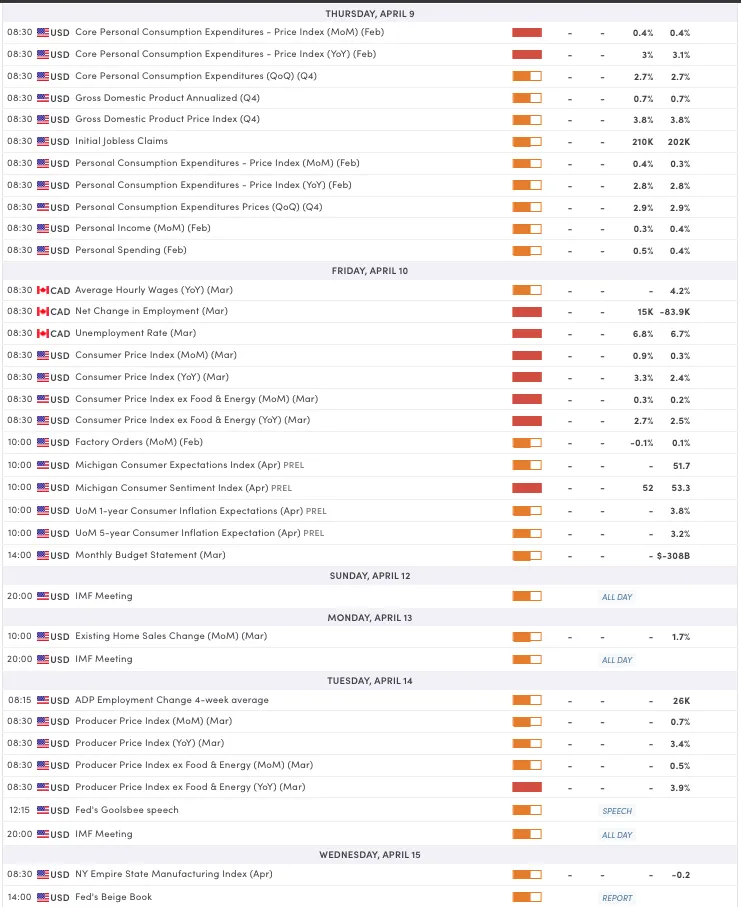
US and Canadian Data towards next Wednesday, MarketPulse Economic Calendar
The North American calendar is absolutely packed until next Wednesday.
Friday will however gather the most attention with US CPI, University of Michigan (Inflation expectations!) and Canadian Employment.
With Middle East developments easing, keep a close eye on Ceasefire news and Oil!
Safe Trades!