Gold (XAU/USD) Rallies 3%, Eyes Acceptance Above $4600/oz Handle for Bullish Momentum to Continue

  • Gold (XAU/USD) prices have broken above the key $4,600/oz psychological barrier.
  • Middle East tensions are escalating as diplomacy stalls and the US continues a military buildup, fueling market uncertainty.
  • The rare negative correlation between Crude and Gold appears to be shifting, with rising Oil prices potentially benefiting Gold by compressing real interest rates and bringing back the “inflation hedge” narrative.
  • Gold needs to find acceptance above the $4600/oz handle for bullish momentum to continue.

Gold prices have risen over the last two days to pierce above a key psychological barrier at the $4600/oz handle. The precious metal is eyeing acceptance above this level which could lead to further upside in the days ahead, if the geopolitical picture remains supportive.

Middle East Tensions: Diplomacy stalls as military buildup adds to market uncertainty

Hopes for a swift de-escalation in the Middle East have taken a hit as Iran signals a clear reluctance to engage in direct negotiations with the US. This friction is undermining what was already a fragile diplomatic process, leaving market participants wary of a prolonged standoff.

Iranian President Pezeshkian summed it up by saying Iran was attacked twice during the talks, proving the US does not believe in diplomacy. However, he followed this up by saying that Iran is ready to end the war, but wants guarantees. This mixed messaging is similar to what we have been seeing from the US administration as well.

Adding fuel to the fire, the US continues to deploy additional troops and military assets to the region. As uncertainty climbs, the focus remains firmly on how these developments will impact broader market sentiment and the demand for safe-haven assets.

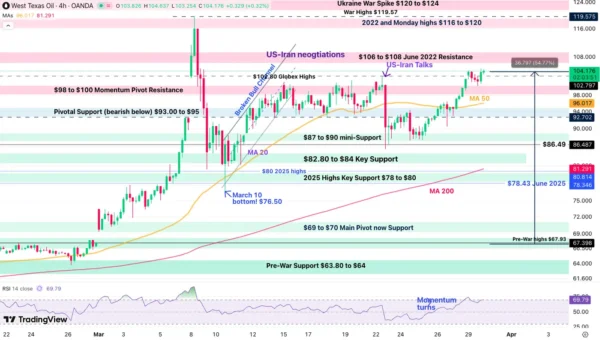
Oil and Gold correlation shifts

Since the onset of the conflict in the Middle East, we have witnessed a rare and sustained negative correlation between Crude and Gold. Usually, these two move in tandem as hedges against geopolitical risk.

However, the recent spike in Oil prices forced a massive repricing of Fed expectations:

Rising Oil = Inflationary Pressure: As energy costs soared, markets were forced to price out previously anticipated Fed rate cuts.

Gold’s Sensitivity: With the “pivot” narrative delayed, Gold lost its luster as a non-yielding asset, leading to the sharpest decline in nearly two decades.

The tide may be turning. Over the last few sessions, we’ve seen Gold and Oil begin to rise at the same time, a signal that the negative correlation is changing.

With Fed funds futures now effectively ruling out further rate cuts, but the market remaining skeptical of additional hikes, we enter a new phase. If the Fed remains on hold while Oil continues to climb, inflation expectations will naturally rise. This scenario would lead to a compression in real interest rates (nominal rates minus inflation).

As long as the Fed remains sidelined and refuses to entertain further hikes, rising Oil prices may actually provide a tailwind for Gold by dragging real yields lower.

For gold bugs, the “inflation hedge” narrative might finally be back on the table.

Where to next?

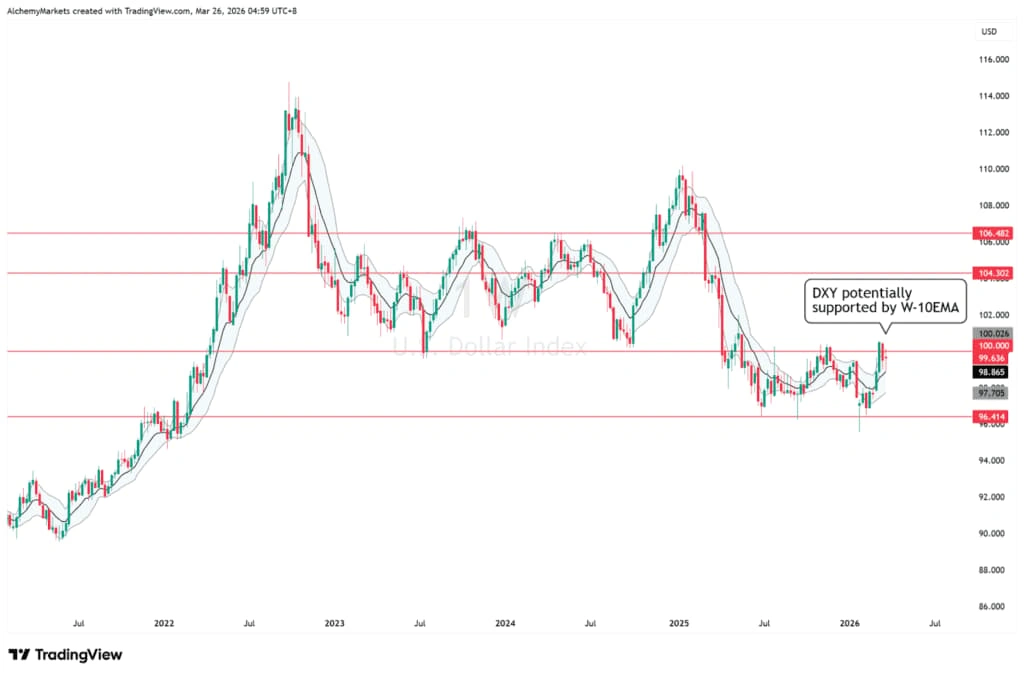
The US dollar is still playing a role and with high impact US data ahead this week we could still see some volatility.

However, it is Easter this weekend and thus the closer to the weekend we get the greater the probability that we could see a thinning of liquidity and thus some sideways price action.

Market participants will still be keeping a close watch on the geopolitical developments in the Middle East and any changes to the situation could impact gold prices.

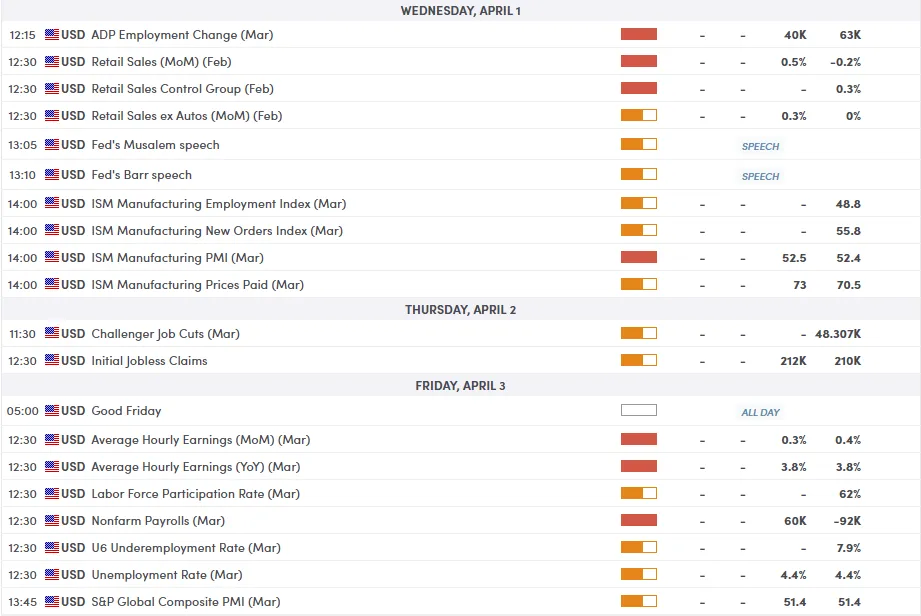
For all market-moving economic releases and events, see the MarketPulse Economic Calendar. (click to enlarge)

Technical Outlook – Gold (XAU/USD)

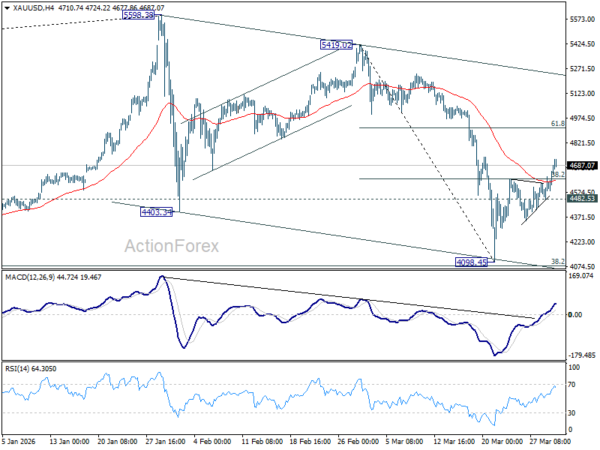
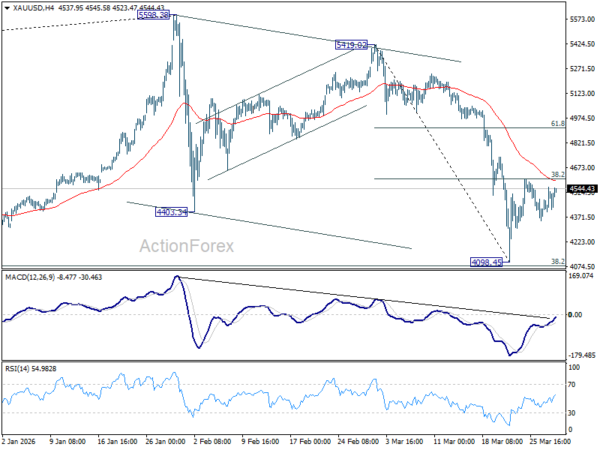
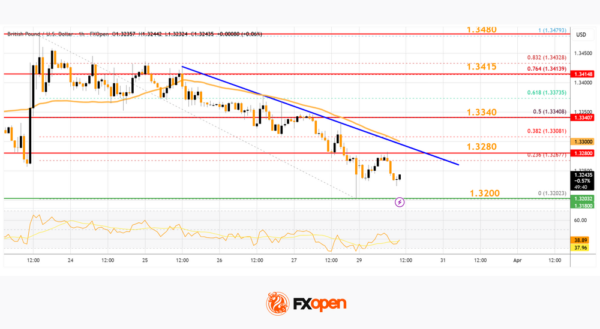
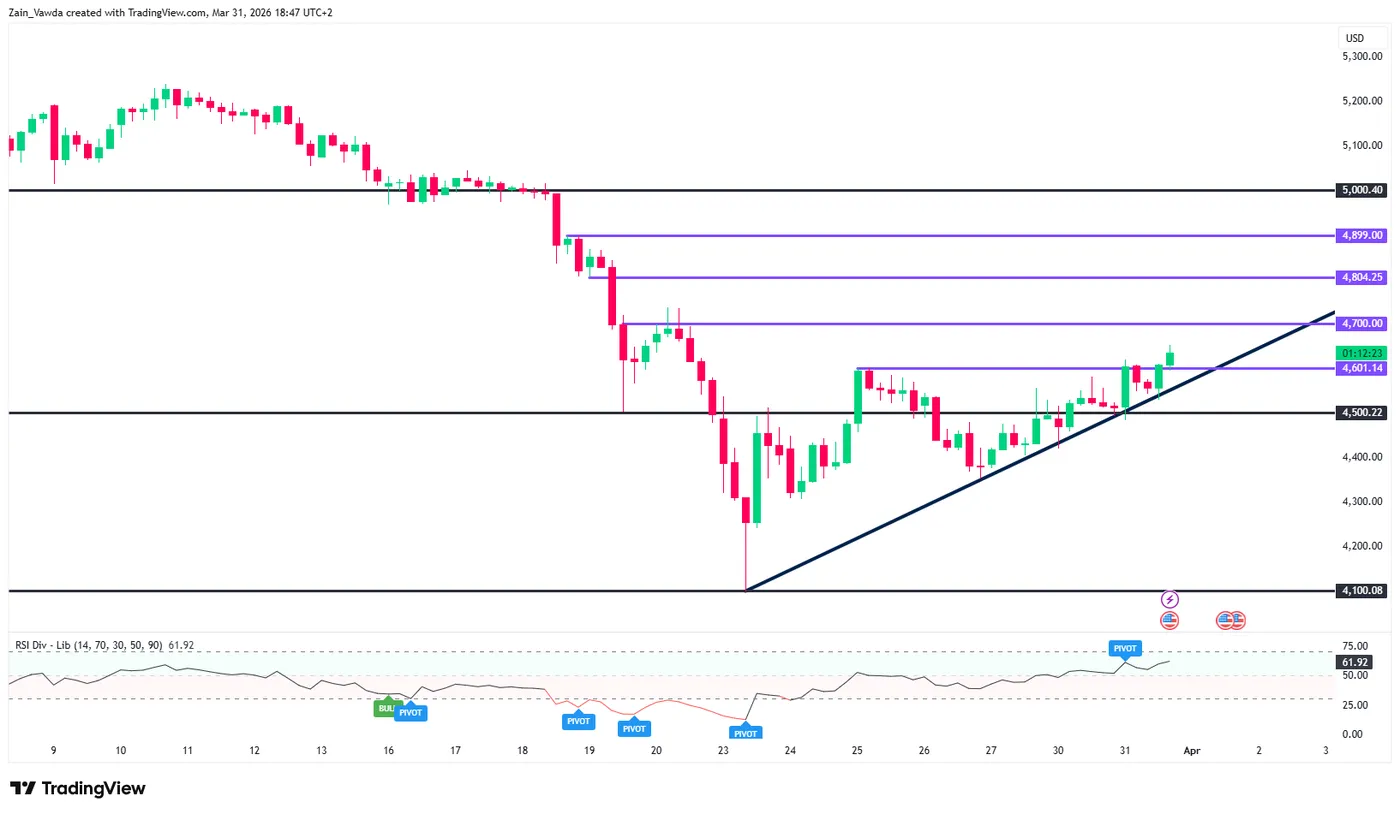
Gold (XAU/USD) is showing signs of a technical recovery on the H4 chart, successfully reclaiming the $4,600 handle.

After a period of aggressive selling, price action has established a solid ascending trendline, suggesting that the “buy the dip” mentality is returning to the market.

Key Levels to Watch:

  • Resistance: The immediate hurdle sits at $4,700. A sustained break above this level could open the door for a retest of the $4,800 area.
  • Support: The recent pivot at $4,500 remains a crucial psychological floor. As long as the ascending trendline holds, the bullish structure remains intact.

The RSI is currently hovering around 62, indicating that while momentum is positive, there is still room to run before hitting overbought territory. Bulls will be looking for a daily close above $4,600 to confirm this recovery phase.

Gold (XAU/USD) Four-Hour Chart, March 31, 2026

Source: TradingView (click to enlarge)

Source link

Visited 1 times, 1 visit(s) today

Related Article

Trump’s Comments Have Triggered a Market Reversal

Trump’s Comments Have Triggered a Market Reversal

Expectations of peace in the Middle East are leading to a sell-off in the US dollar. Gold is the main beneficiary of the conflict’s resolution. And the last shall be first. EURUSD bulls have launched a counterattack following Donald Trump’s announcement that the conflict in the Middle East would be resolved within 2–3 weeks. The

Gold Price Breaks 4,600: Reversal or Bull Trap? Q2 Becomes Battleground

Gold Price Breaks 4,600: Reversal or Bull Trap? Q2 Becomes Battleground

Gold Price’s break above the 4,600 level this week has reignited bullish momentum, but the move raises a deeper question — is this a genuine reversal or a temporary bounce? After a sharp Q1 correction, Q2 is now shaping up as the decisive battleground that will determine whether Gold is reversing higher or merely recovering

Japan PMI Manufacturing Finalized at 51.6, War-Driven Cost Pressures Build

Japan PMI Manufacturing Finalized at 51.6, War-Driven Cost Pressures Build

Japan’s PMI Manufacturing was finalized at 51.6 in March, down from February’s 45-month high of 53.0, signaling moderation in growth momentum. Even so, the reading still marked the second-strongest performance since July 2022, with Q1 overall delivering the best quarterly showing since Q2 2022. S&P Global Market Intelligence’s Annabel Fiddes noted that the slowdown coincided

Bitcoin Edges Higher, Recovery Signals Early Strength

Bitcoin Edges Higher, Recovery Signals Early Strength

Key Highlights Bitcoin started a recovery wave above $66,500 and $67,000. A bearish trend line is forming with resistance at $68,500 on the 4-hour chart of BTC/USD. Ethereum also climbed over 4% and surpassed $2,050. Gold is grinding higher toward the $4,760 resistance. Bitcoin Price Technical Analysis Bitcoin price remained supported above $65,000 against the

EUR/USD Mid-Day Outlook - ActionForex

EUR/USD Mid-Day Outlook – ActionForex

Daily Pivots: (S1) 1.1429; (P) 1.1476; (R1) 1.1509; More…. EUR/USD recovered ahead of 1.1408 support as consolidations continue. Intraday bias remains neutral for the moment. Further decline is expected with 1.1666 cluster resistance (38.2% retracement of 1.2081 to 1.1408 at 1.1665) intact. On the downside, firm break of 1.1408 will resume the fall from 1.2081

USD, EUR, JPY and top FX trades to watch

USD, EUR, JPY and top FX trades to watch

Q2 does not look like a straightforward directional quarter for forex. The market keeps trying to price de-escalation, but oil, inflation and policy expectations are still tied to an unstable geopolitical backdrop. That leaves the quarter feeling reactive rather than settled. The better opportunities are not broad one-way trades, but relative-value trades where policy, growth

Crude Oil Price Analysis – Oil Continues to Move to Headlines

Subscribe To Notifications Scan QR code to install app Important DisclaimersFXEmpire is owned and operated by Empire Media Network LTD., Company Registration Number 514641786, registered at 7 Jabotinsky Road, Ramat Gan 5252007, Israel. The content provided on this website includes general news and publications, our personal analysis and opinions, and materials provided by third parties.

GBP/USD Continues Slide, Momentum Turns Firmly Bearish

GBP/USD Continues Slide, Momentum Turns Firmly Bearish

Key Highlights GBP/USD started a fresh decline and traded below 1.3320. It traded below a bullish trend line with support at 1.3290 on the 4-hour chart. EUR/USD remained in a bearish zone below 1.1580. WTI Crude Oil prices are again moving higher above $98.00. GBP/USD Technical Analysis The British Pound faced rejection near 1.3480 against

Chart

The expected market pullback most traders will miss again

Markets rarely reward consensus in the way most participants expect. Right now, a large portion of traders are anticipating a pullback. But anticipation alone does not translate into execution. In reality, most participants will enter too early, hesitate when the opportunity appears, or miss the move entirely. This is not randomness—it is the result of

Forex Trading

What Business Professionals Get Wrong About Forex Trading

Forex trading has a reputation problem. For many business professionals, it sits in the same mental category as sports betting or casino gambling — something speculative, reckless, and best avoided. This perception is not entirely unfounded. The industry has its share of aggressive marketing, unrealistic promises, and poorly educated retail participants who treat currency markets

KVB Futures Marks 1st Anniversary, Sustaining Growth Amid Indonesia’s Expanding and Competitive Forex Market

JAKARTA, Indonesia, March 31, 2026 /PRNewswire/ — Indonesia’s retail trading and investment landscape is rapidly expanding, driven by rising financial literacy, digital adoption, and growing interest in global markets. As more individuals explore forex and multi-asset trading, the brokerage industry is becoming increasingly dynamic and competitive. KVB Futures Anniversary KVB Futures, marking its 1st anniversary

Silver Price Gains “Oxygen” from Yield Pullback; Break Above 74.52 to Confirm Momentum

Silver Price Gains “Oxygen” from Yield Pullback; Break Above 74.52 to Confirm Momentum

Silver price strengthened notably as a sharp pullback in US Treasury yields provided fresh support for precious metals, with markets reassessing Federal Reserve policy outlook following yesterday’s comments from Chair Jerome Powell. The decline in yields, alongside softer rate expectations, has eased pressure on non-yielding assets, giving Silver the “oxygen” to rebound and push toward

STARTRADER launches Web STAR Copy expanding social trading

STARTRADER launches Web STAR Copy expanding social trading

Dubai based Retail FX and CFDs broker STARTRADER has announced that it has introduced Web STAR Copy, a new web-based feature designed to simplify access to copy trading and enable more structured participation in financial markets. The feature allows traders to follow and copy strategies from experienced participants, improving execution consistency and overall trading efficiency. As

Elliott Wave Outlook: Oil (CL) Zigzag Rally Targets $110 Area

Elliott Wave Outlook: Oil (CL) Zigzag Rally Targets $110 Area

After surging to $119.7 on March 9, crude oil experienced a sharp decline, reaching $76.73 by March 11. This retreat unfolded in the form of a five-wave impulsive Elliott Wave structure, marking a decisive corrective phase. From the March 9 peak, wave (1) concluded at $96.25, followed by a rebound in wave (2) that terminated

Gold Rebound From 4100 Suggests “Wyckoff Accumulation,” With Two Key Tests Ahead

Gold Rebound From 4100 Suggests “Wyckoff Accumulation,” With Two Key Tests Ahead

Gold’s current resilience in the face of the broad-based Dollar rally is raising the possibility that the recent decline has transitioned into a “Wyckoff Accumulation” phase. The sharp drop to 4,100 last week, followed by a swift recovery toward 4,600, suggests that what initially appeared to be a breakdown may instead have been a liquidity-driven

Is the War Really Reaching Its End? Assets Bounce Despite Oil Rally – Market Check

Is the War Really Reaching Its End? Assets Bounce Despite Oil Rally – Market Check

We are now officially entering the fifth week of the US-Iran-Israel conflict, which sent bombs flying all over the Middle East, but more concerningly, sent Global Assets flying all over. The main culprit was Crude Oil prices – rallying about 50% since its Monthly open, the commodity hasn’t failed to contribute its fair part in

EUR/JPY Mid-Day Outlook - ActionForex

EUR/JPY Mid-Day Outlook – ActionForex

Daily Pivots: (S1) 184.00; (P) 184.34; (R1) 184.81; More… EUR/JPY’s accelerated decline and break of 183.17 minor support should confirm rejection by 184.75 resistance. Intraday bias is back on the downside for 181.85 support. Firm break there will argue that the correction from 186.86 is already in the third leg, and should target 180.78 and

Assistant professor loses Rs 70L in forex trading scam

Assistant professor loses Rs 70L in forex trading scam | Ahmedabad News

Ahmedabad: A 39-year-old assistant professor posted at a govt hospital has approached the Cybercrime police claiming he was cheated of more than Rs 70 lakh in a forex trading scam run through Telegram. According to the complaint lodged on March 29, the victim, a native of Rajasthan who currently stays in a hospital hostel, was

USD/CHF Mid-Day Outlook - ActionForex

USD/CHF Mid-Day Outlook – ActionForex

Daily Pivots: (S1) 0.7955; (P) 0.7974; (R1) 0.8009; More…. USD/CHF’s rally from 0.7603 is in progress and intraday bias stays on the upside. Further rise should be seen to 38.2% retracement of 0.9200 to 0.7603 at 0.8213. On the downside, below 0.7951 minor support will turn intraday bias neutral first. But further rally is expected

GBP/USD Dips Further As EUR/GBP Regains Traction

GBP/USD Dips Further As EUR/GBP Regains Traction

GBP/USD failed to climb above 1.3500 and corrected some gains. EUR/GBP started a decent increase and might aim for more gains above 0.8700. Important Takeaways for GBP/USD and EUR/GBP Analysis Today The British Pound is showing bearish signs below the 1.3400 support. There is a key bearish trend line forming with resistance near 1.3280 on

0
Would love your thoughts, please comment.x
()
x