Is the War Really Reaching Its End? Assets Bounce Despite Oil Rally – Market Check

We are now officially entering the fifth week of the US-Iran-Israel conflict, which sent bombs flying all over the Middle East, but more concerningly, sent Global Assets flying all over.

The main culprit was Crude Oil prices – rallying about 50% since its Monthly open, the commodity hasn’t failed to contribute its fair part in overall volatility.

After sustaining a broad, inverted correlation with most asset classes and currencies, this trend appears to be abating – Traders are now really looking to relax their preceding angst with the US entering into more consistent negotiations with their enemy-counterpart in the Islamic regime, and Israel also prepares for final waves of attack to dampen the military reconstruction efforts.

Black Gold is now at a spot where uncertainty is priced in, leaving only a premium for the proper lack of supply that would traditionally go through the infamous Strait of Hormuz.

Brent has been stuck above $110 since the weekly open, and WTI remains well above $100.

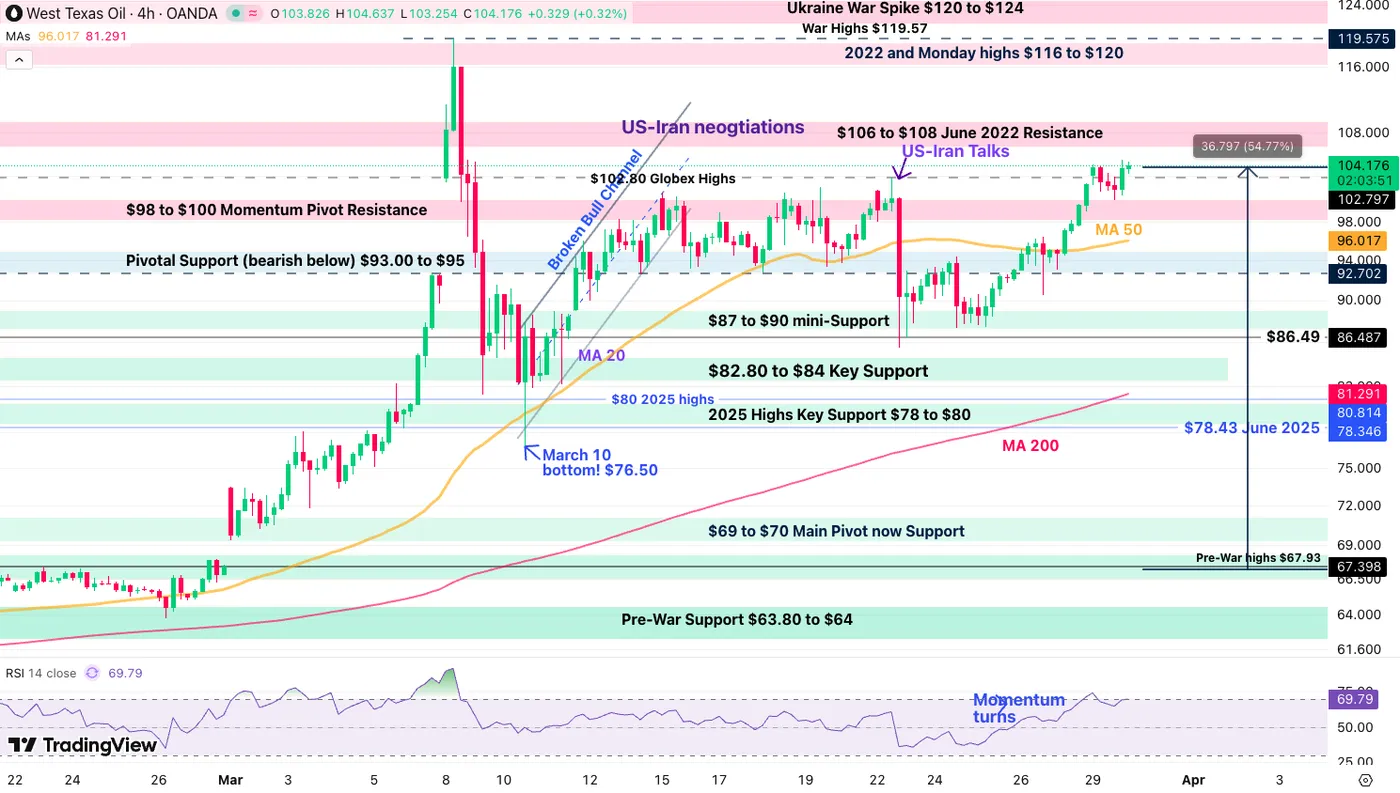
WTI 4H Chart – Source: TradingView. March 30, 2026

Key levels to watch for WTI:

To the upside:

  • $106 ~ Closing above could maintain further bullish pressure
  • $110 ~ Psychological level not seen since the mid-March spike
  • $120 ~ War highs, above this, things could get catastrophic for the economy

To the downside:

  • $100 ~ Correcting back below would boost the current ease in sentiment significantly
  • $90 ~ Short-term momentum turns bearish for the commodity, Markets should pick up their rebound
  • $85 ~ Any move below this would confirm that the situation is indeed not worsening, best sign for Markets – Every asset becomes a buy on a daily close below.

Oil rising isn’t such a surprise to most of us, but the more peculiar change in today’s flows comes from the fact that at a despite this rise, Bonds are rallying (yields lower – implying lower inflation expectations), Stocks bounced, but seem to remain under pressure (at least, not worsening for now) and Metals have formed what a more consistent bottom.
finviz perf 3003

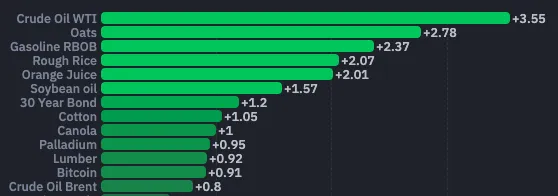
An Unfamiliar Session in Markets – Courtesy of Finviz

If anything was dampening Market mood throughout last week, it was the fact that failed diplomatic attempts could not generate a much larger continuum of tranquility.

But if the current, more realistic, conversations really turn into something positive, the 5-week period could be precise, and next week could be a great opportunity to join a bounce.

It is, of course, very early to say, considering that the US President and his Administration are so unpredictable, and it would be a mistake to assume that the Iranian regime is not.

In any case, month-end is approaching and could bring significant changes to the flows Participants have been accustomed to throughout this long and crazy March.

US Treasuries are rallying, the most optimistic sign

US Bonds (and Fixed Income in general) were among the worst performers across all asset classes this month, under intense pressure from rising inflation expectations.

With the tumble in Fixed-Income (and rising yields), Bond Vigilantes were pricing out all types of Rate Cuts across the globe, implying that the repercussions of rising Oil would prevent lower rates and even lead to some Monetary Policy rises (as seen in Europe and England).

Why is it important to check bonds in this environment? This asset class is the most reactive to risk news and inflation expectations – If they ease, other assets will be subject to much less constraints (as Stocks tend to see delayed bounces in such an environment).

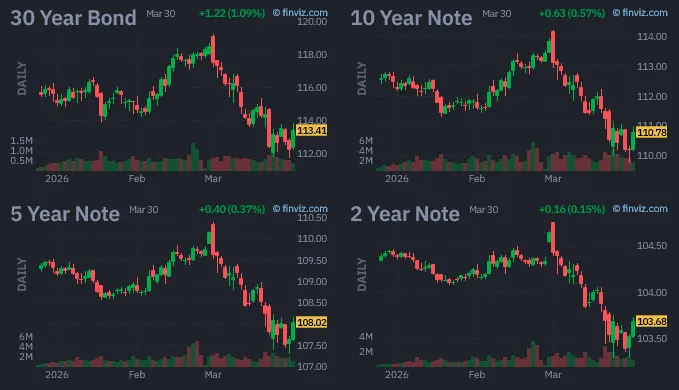
US Bonds since beginning March – Courtesy of Finviz

Despite their morning bounce, they still have a lot to recover, and their bounce is proving challenged by the fresh bid in Oil.

  • For the 30Y Yield, keep a close eye on 5.00% to the upside, 4.75% to the downside.
  • For the 2Y Yield, 4.03% to the upside (+ hikes priced in) and 3.75% to the downside.

Metals rebound but still under pressure

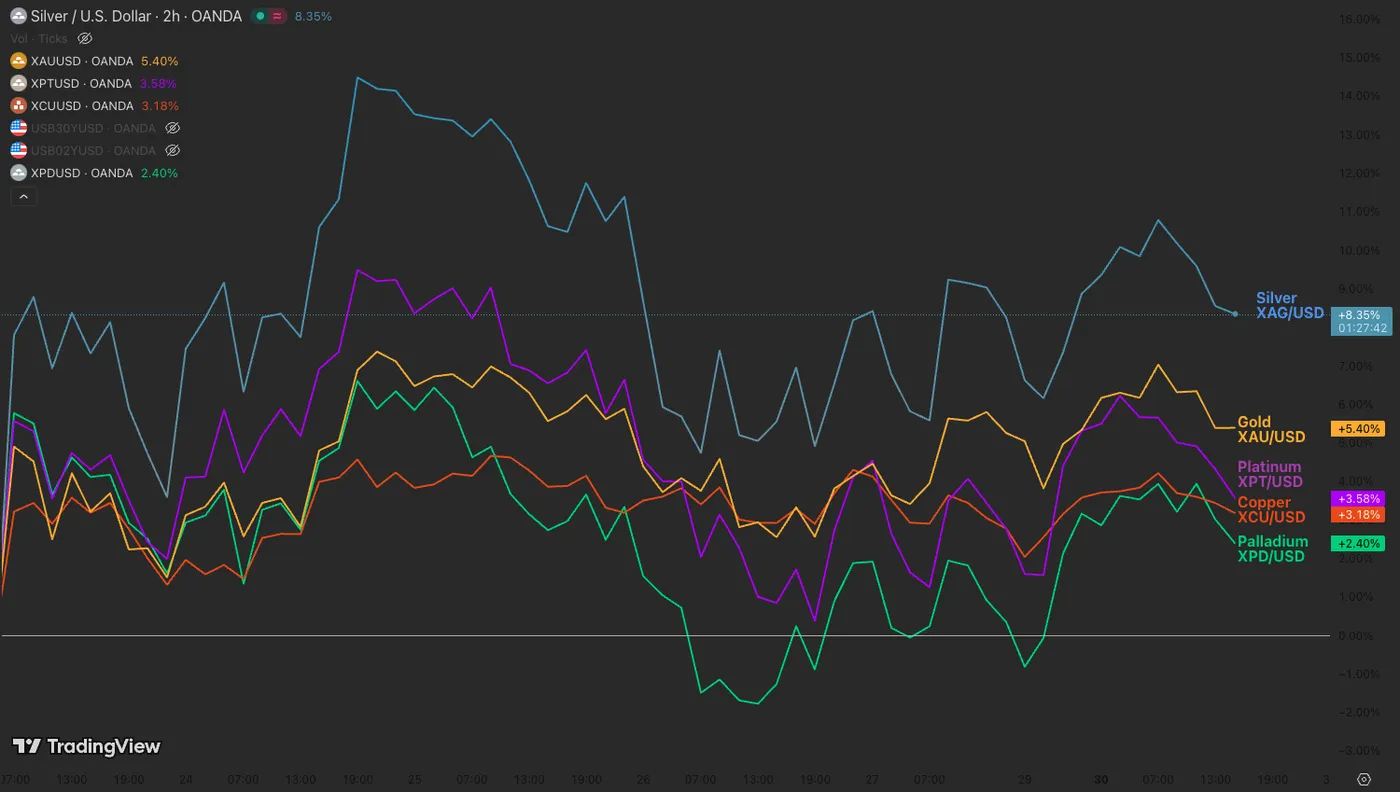
Metals performance since last Monday – Source: TradingView

Metals have indeed marked their bottom, but the rest will be to see if they can actually maintain a higher path for longer.

Their nature as diversification asset hold them in the middle of two different narratives –

  • Are they going to rally from the lower hike pricings?
  • Are they going to resume their drops from the drop in uncertainty?

In this mix of fate, it seems that rangebound conditions may prevail in the precious commodities until a breakout follows.

The US Dollar remains on top of its game

Despite the easing narrative, the US Dollar remains a top-dog in this weekly open.

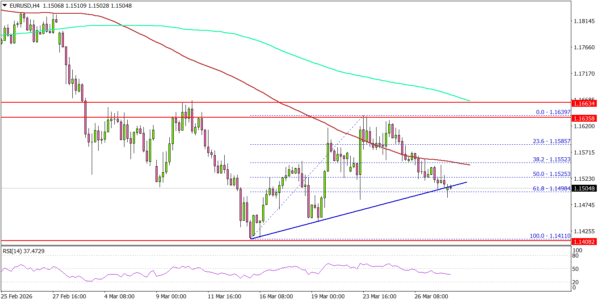
The Dollar Index is pointing towards a breakout, but failing here may also form a double-top, so expect this monthly close to be a significant indicator for what’s to come for FX Markets in April.

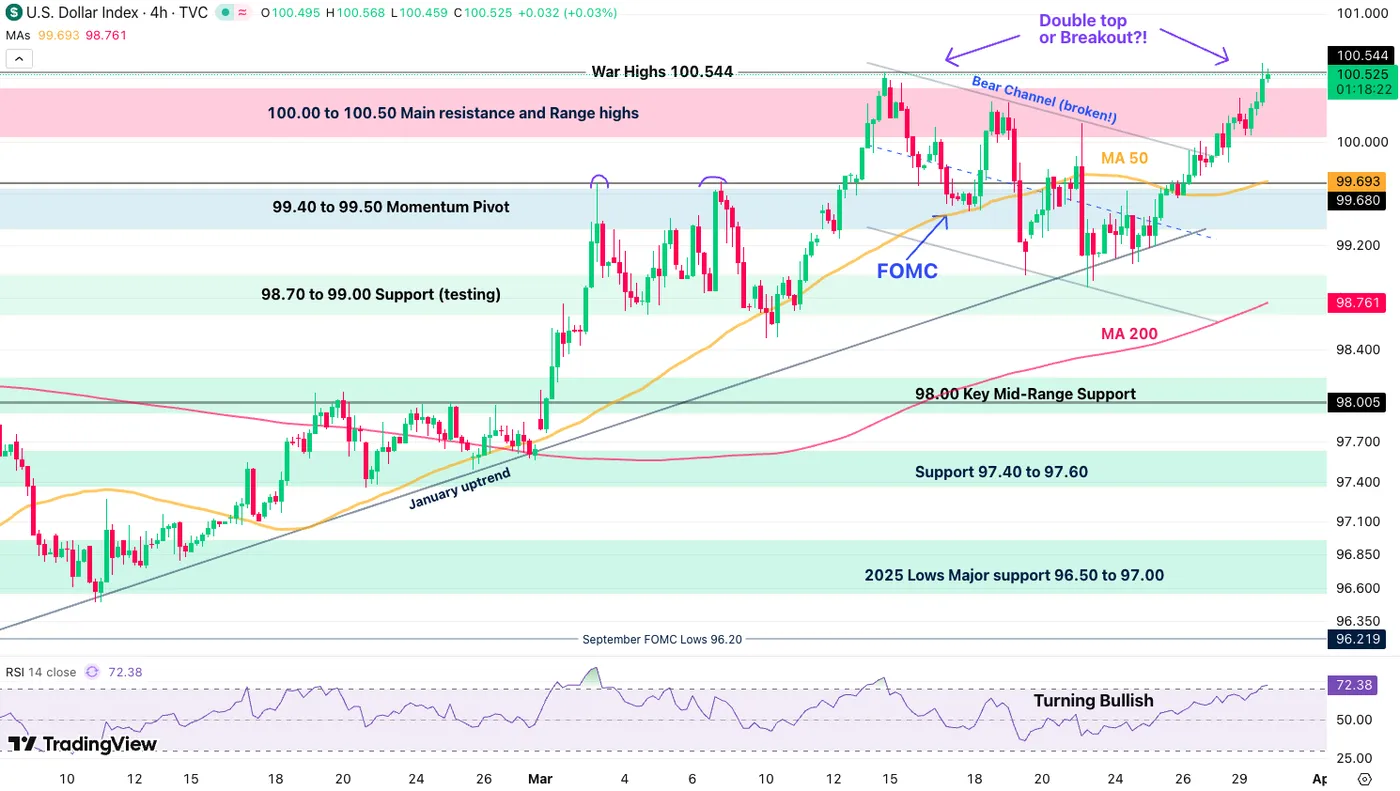
Dollar Index 4H Chart – Source: TradingView. March 30, 2026

The direction is for now difficult to predict, with the latest rally being very persistent – So the best is to wait for confirmation.

Rejecting back in the 100.30 resistance should see continuation to the downside.
Breaking and closing on the month above 100.60 could lead to a larger USD breakout.

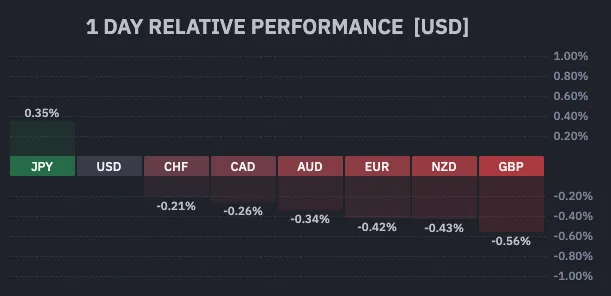
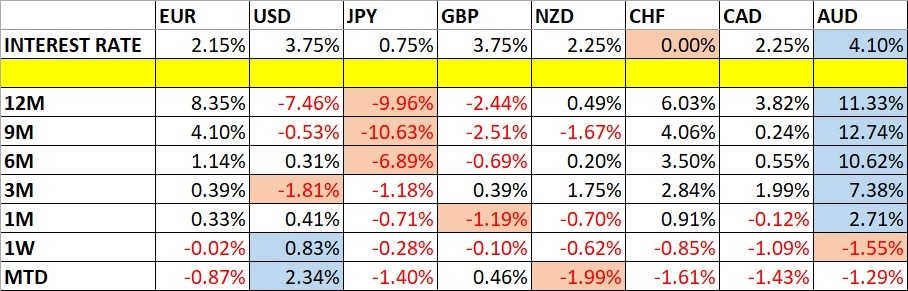
The current FX Session – Courtesy of Finviz

Markets are repricing an imminent FX Intervention for the JPY, prompting its outperformance in today – Apart from it, the US Dollar is flawless in its daily rally.

Month-end flows (throughout the session tomorrow) will be a preview of what’s to come!

Safe Trades and keep track of the conflict progress throughout this week!

Source link

Visited 1 times, 1 visit(s) today

Related Article

Gold Rebound From 4100 Suggests “Wyckoff Accumulation,” With Two Key Tests Ahead

Gold Rebound From 4100 Suggests “Wyckoff Accumulation,” With Two Key Tests Ahead

Gold’s current resilience in the face of the broad-based Dollar rally is raising the possibility that the recent decline has transitioned into a “Wyckoff Accumulation” phase. The sharp drop to 4,100 last week, followed by a swift recovery toward 4,600, suggests that what initially appeared to be a breakdown may instead have been a liquidity-driven

EUR/JPY Mid-Day Outlook - ActionForex

EUR/JPY Mid-Day Outlook – ActionForex

Daily Pivots: (S1) 184.00; (P) 184.34; (R1) 184.81; More… EUR/JPY’s accelerated decline and break of 183.17 minor support should confirm rejection by 184.75 resistance. Intraday bias is back on the downside for 181.85 support. Firm break there will argue that the correction from 186.86 is already in the third leg, and should target 180.78 and

Assistant professor loses Rs 70L in forex trading scam

Assistant professor loses Rs 70L in forex trading scam | Ahmedabad News

Ahmedabad: A 39-year-old assistant professor posted at a govt hospital has approached the Cybercrime police claiming he was cheated of more than Rs 70 lakh in a forex trading scam run through Telegram. According to the complaint lodged on March 29, the victim, a native of Rajasthan who currently stays in a hospital hostel, was

USD/CHF Mid-Day Outlook - ActionForex

USD/CHF Mid-Day Outlook – ActionForex

Daily Pivots: (S1) 0.7955; (P) 0.7974; (R1) 0.8009; More…. USD/CHF’s rally from 0.7603 is in progress and intraday bias stays on the upside. Further rise should be seen to 38.2% retracement of 0.9200 to 0.7603 at 0.8213. On the downside, below 0.7951 minor support will turn intraday bias neutral first. But further rally is expected

GBP/USD Dips Further As EUR/GBP Regains Traction

GBP/USD Dips Further As EUR/GBP Regains Traction

GBP/USD failed to climb above 1.3500 and corrected some gains. EUR/GBP started a decent increase and might aim for more gains above 0.8700. Important Takeaways for GBP/USD and EUR/GBP Analysis Today The British Pound is showing bearish signs below the 1.3400 support. There is a key bearish trend line forming with resistance near 1.3280 on

GBP/JPY Mid-Day Outlook - ActionForex

GBP/JPY Mid-Day Outlook – ActionForex

Daily Pivots: (S1) 212.15; (P) 212.65; (R1) 213.08; More… GBP/JPY’s strong break of 210.77 support suggests that rebound from 207.20 has completed at 213.29. The pattern from 214.98 should now be in the third leg. Intraday bias is back on the downside for 209.15 support first. Firm break there will target 207.20 next. For now,

USD/JPY Mid-Day Outlook - ActionForex

USD/JPY Mid-Day Outlook – ActionForex

Daily Pivots: (S1) 159.70; (P) 160.05; (R1) 160.65; More… Intraday bias in USD/JPY stays neutral for the moment. Some consolidations would be seen but further rally is still in favor. Above 160.45 will bring retest of 161.94 high. Nevertheless, considering bearish divergence condition in 4H MACD, sustained break of 55 4H EMA (now at 159.20)

Eurozone Sentiment Weakens Further as ESI Falls to 96.6

Eurozone Sentiment Weakens Further as ESI Falls to 96.6

Sentiment in Europe deteriorated further in March, with the Economic Sentiment Indicator falling from February to 96.6 in the Eurozone and to 96.7 in the EU, both moving further below the long-term average of 100. The Employment Expectations Indicator also declined to 97.3 and 96.4 respectively. The decline in sentiment was driven primarily by a

GBP/JPY Daily Outlook - ActionForex

GBP/JPY Daily Outlook – ActionForex

Daily Pivots: (S1) 212.15; (P) 212.65; (R1) 213.08; More… GBP/JPY falls notably today but stays above 210.77 support. Intraday bias remains neutral first. on the upside, above 213.28/9 resistance will resume the rise from 207.20 to retest 214.98 high. However, firm break of 210.77 will argue that the pattern from 214.98 has entered its third

Gold Holds Steady Within Fresh Range Near 4,500

Gold Holds Steady Within Fresh Range Near 4,500

Gold pares gains below uptrend line on softer Dollar. Dip‑buyers emerge, but upside remains limited. Momentum signals maintain a neutral‑to‑bearish stance. Gold is holding steady near 4,500 on Monday, attempting to build on last session’s 2.5% rebound as a softer dollar offsets fading rate‑cut expectations. Still, the precious metal struggles to attract strong dip‑buying interest

EUR/USD Under Pressure, Is Another Leg Lower Imminent?

EUR/USD Under Pressure, Is Another Leg Lower Imminent?

Key Highlights EUR/USD started a fresh decline and traded below 1.1550. It traded below a bullish trend line with support at 1.1520 on the 4-hour chart. GBP/USD extended losses and traded below 1.3320. Gold prices are showing signs of weakness below $4,550. EUR/USD Technical Analysis The Euro failed to settle above 1.1620 against the US

Weekly Forex Forecast - 29th March

Weekly Forex Forecast – 29th March

Fundamental Analysis & Market Sentiment I wrote on 22nd March that the best trades for the week would be: Long of the USD/JPY currency pair. This gave a win of 0.95%. Long of Brent Crude Oil but with ¼ of the normal position size. This gave a loss of 1.85%. Last week’s overall loss of

Table of prices Nasdaq 100 29/03/2026

Weekly Pairs in Focus 29th March to 3rd April 2026 (Charts)

Created on March 29, 2026 NASDAQ 100 The Nasdaq 100 initially tried to rally during the week but has collapsed as fear continues to grip the market. Interest rates in America continue to climb and we have now sliced through the crucial 23,800 level. We are below the 50-week EMA as well and quite frankly;

AUD/USD Daily Report - ActionForex

AUD/USD Daily Report – ActionForex

Daily Pivots: (S1) 0.6853; (P) 0.6907; (R1) 0.6941; More… Intraday bias in AUD/USD on the downside as this point. Fall from 0.7187 is seen as correcting the whole up trend from 0.5913. Deeper decline would be seen to 38.2% retracement of 0.5913 to 0.7187 at 0.6700. On the upside, though, above 0.6956 minor resistance will

EUR/AUD Daily Outlook - ActionForex

EUR/AUD Daily Outlook – ActionForex

Daily Pivots: (S1) 1.6651; (P) 1.6706; (R1) 1.6796; More… EUR/AUD’s rise from 1.6125 short term bottom continues today and intraday bias remains on the upside. Sustained break of 55 D EMA (now at 1.6755) will pave the way to 38.2% retracement of 1.8554 to 1.6125 at 1.7053. Nevertheless, below 1.6607 minor support will turn intraday

Trading app scams surge 1,400%: Millions of US investors at risk as trading interest soars, expert warns

Trading app scams surge 1,400%: Millions of US investors at risk as trading interest soars, expert warns

Beware of fakes and impersonations Scammers often create fake versions of popular trading platforms to trick users into sharing their personal information. With AI, these clones can be extremely convincing, replicating layouts, logos and even fake testimonials. Hence, always check the URLs carefully since scammers often use slightly altered domain names to catch careless users out.  If anything seems suspicious, change your

USD/CAD Weekly Outlook - ActionForex

USD/CAD Weekly Outlook – ActionForex

USD/CAD’s rebound from 1.3480 accelerated high last week. Initial bias stays on the upside this week for 38.2% retracement of 1.4791 to 1.3480 at 1.3981. Decisive break there will argue that it’s already reversing the whole down trend from 1.4791, and target 61.8% retracement at 1.4290. On the downside, below 1.3844 minor support will turn

EUR/GBP Weekly Outlook - ActionForex

EUR/GBP Weekly Outlook – ActionForex

EUR/GBP stayed in range trading above 0.8610 last week. Initial bias remains neutral this week first. On the upside, sustained break above 55 D EMA (now at 0.8680) will confirm short term bottoming, and bring stronger rebound back to 0.8788 resistance. However, rejection by 55 D EMA will set up another fall through 0.8611 to

0
Would love your thoughts, please comment.x
()
x