I wrote piece last week called A Short History of Stock Market Pullbacks to show how often stocks are down certain levels over time:
I like to do this when the stock market falls just as a reminder that it’s completely normal.
Here’s the natural follow-up question I received:
Do you have any charts or data for the “bounce back” periods following these pullbacks?
I’ve done versions of this in the past but nothing at the various levels of losses in one place.
Let’s do it.
Here’s what I did:
I have S&P 500 data going back to 1950. I crunched the numbers to see when the S&P 500 was down 10%, 20% and 30% at the end of each month.1 Then I calculated the forward one, three and five year total returns from each of those loss levels to see how you would have fared over the past 76 years or so if you had invested at those breakpoints.
Here are the average returns along with the win rates for each:
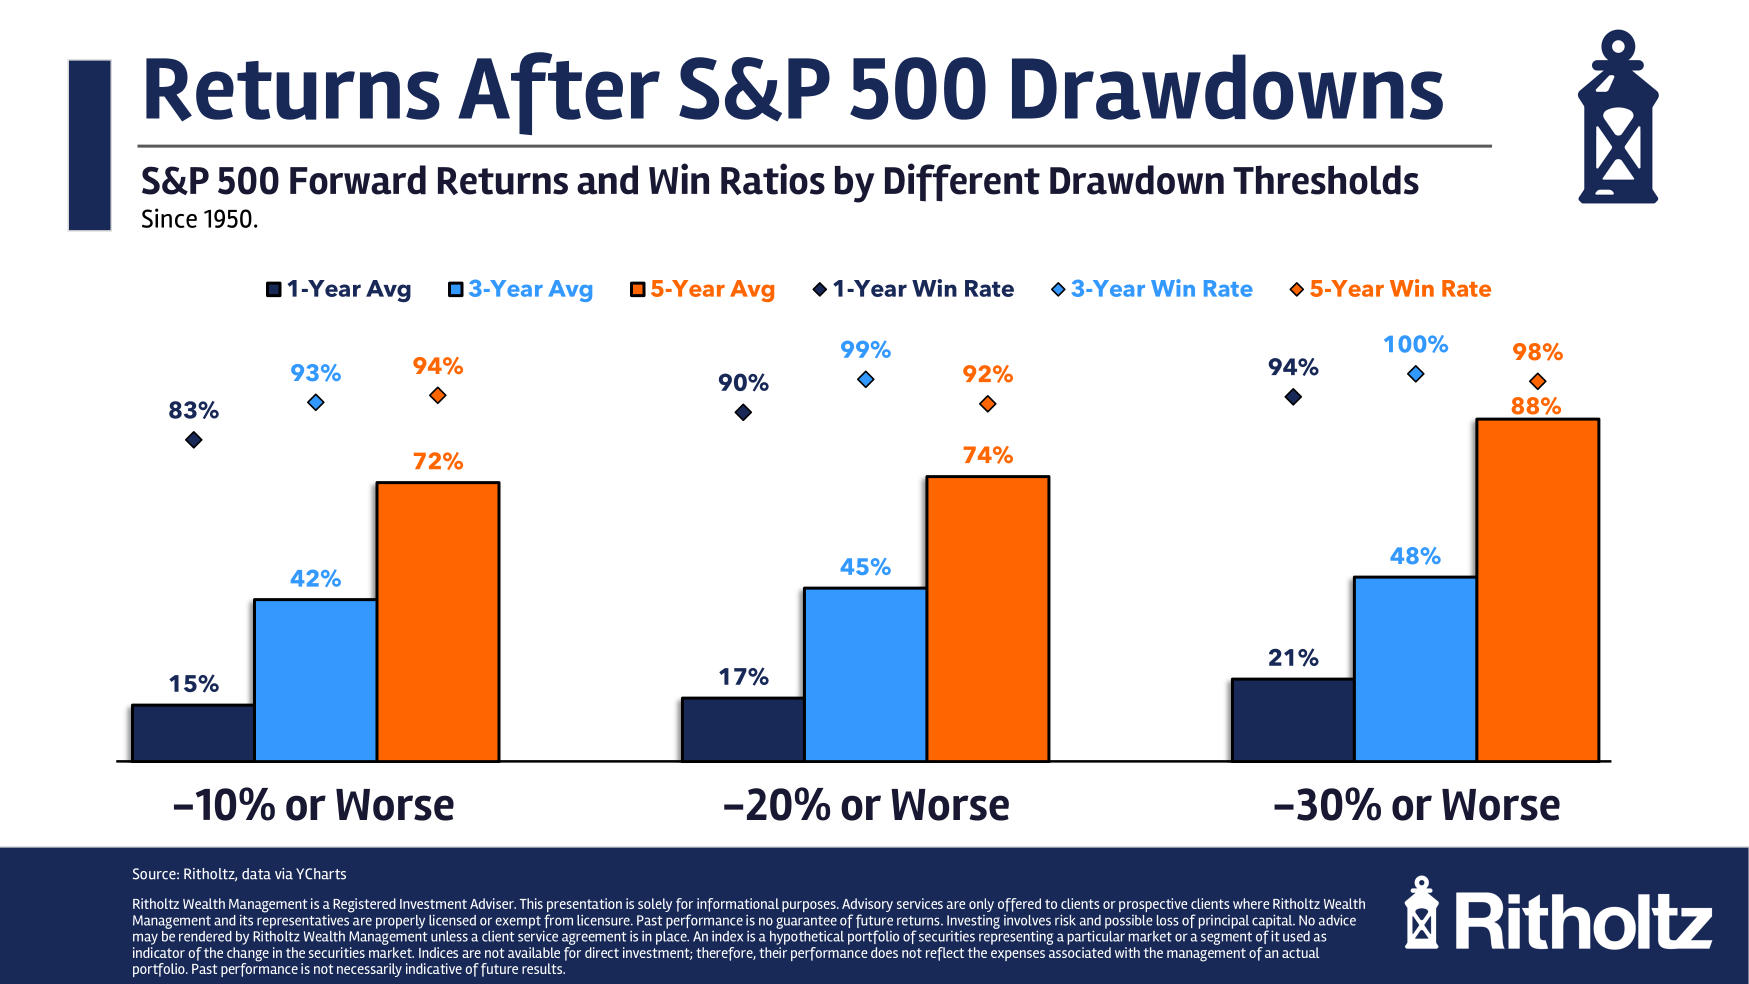
Since 1950, if you bought stocks every time the month ended down 10% or worse, on average you were up 15%, 42% and 72% in total one, three and five years later, respectively.
If you bought stocks every time the month ended down 20% or worse, on average you were up 17%, 45% and 74% in total one, three and five years later, respectively.
And if you bought stocks every time the month ended down 30% or worse, on average you were up 21%, 48% and 88% in total one, three and five years later, respectively.
These are just averages but look at the win rates. Sometimes stocks were still down one, three and five years later but it was rare. Most of the time stocks are up when you buy them when they’re down.
The usual caveat that past performance is not indicative of future performance always applies to studies like this.
The S&P 500 is currently down just shy of 9% from the highs. Maybe this downturn gets way worse or maybe it’s just a run-of-the-mill correction that’s nothing more than a flesh wound.
Either way, successful long-term investing always involves losses. Most of the time those losses lead to gains in the future.
The hard part, as always, is no one know how big the losses will get in the meantime.
That’s risk for you.
If you didn’t have the risk you wouldn’t get the returns.
Further Reading:
A Short History of Stock Market Pullbacks
1Why only the end of the month? I like using total return data and only have that on a monthly basis. It’s cleaner.
This content, which contains security-related opinions and/or information, is provided for informational purposes only and should not be relied upon in any manner as professional advice, or an endorsement of any practices, products or services. There can be no guarantees or assurances that the views expressed here will be applicable for any particular facts or circumstances, and should not be relied upon in any manner. You should consult your own advisers as to legal, business, tax, and other related matters concerning any investment.
The commentary in this “post” (including any related blog, podcasts, videos, and social media) reflects the personal opinions, viewpoints, and analyses of the Ritholtz Wealth Management employees providing such comments, and should not be regarded the views of Ritholtz Wealth Management LLC. or its respective affiliates or as a description of advisory services provided by Ritholtz Wealth Management or performance returns of any Ritholtz Wealth Management Investments client.
References to any securities or digital assets, or performance data, are for illustrative purposes only and do not constitute an investment recommendation or offer to provide investment advisory services. Charts and graphs provided within are for informational purposes solely and should not be relied upon when making any investment decision. Past performance is not indicative of future results. The content speaks only as of the date indicated. Any projections, estimates, forecasts, targets, prospects, and/or opinions expressed in these materials are subject to change without notice and may differ or be contrary to opinions expressed by others.
The Compound Media, Inc., an affiliate of Ritholtz Wealth Management, receives payment from various entities for advertisements in affiliated podcasts, blogs and emails. Inclusion of such advertisements does not constitute or imply endorsement, sponsorship or recommendation thereof, or any affiliation therewith, by the Content Creator or by Ritholtz Wealth Management or any of its employees. Investments in securities involve the risk of loss. For additional advertisement disclaimers see here: https://www.ritholtzwealth.com/advertising-disclaimers
Please see disclosures here.