In today’s Market Outlook, let’s take a look at Forex Trading on the NASDAQ, the DAX40, WTI, and Brent Crude Oil, AUD/USD, USD/JPY, USD/CHF, Silver, XAG/USD, and Gold, XAU/USD.
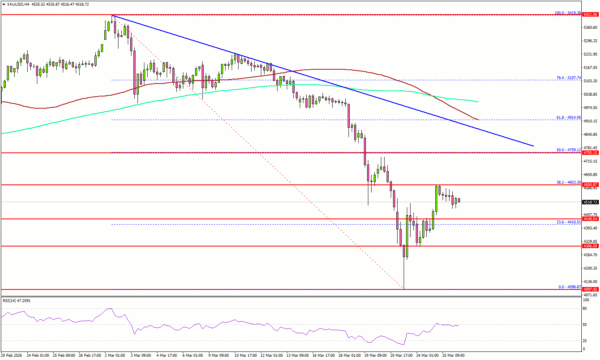
Looking at the big picture, we see both Gold and Silver in downtrends with support at $4,100 and $61, respectively.
From the technical side, we will be looking at these trend lines, both in bear runs.

We see the stochastic oscillators looking oversold and turning back up, but the prevailing technical trade is still a Sell position.
If we add MACD on the 4-hour charts, we see that we are entering bearish territory again, so waiting on a short trade might be prudent.
However, make no mistake, this is a fundamental trade first, not a technical trade.
Both silver and gold are traded against USD, so next week’s economic news may affect USD, with Jerome Powell speaking at Harvard and, later in the week, the Non-Farm Payrolls.
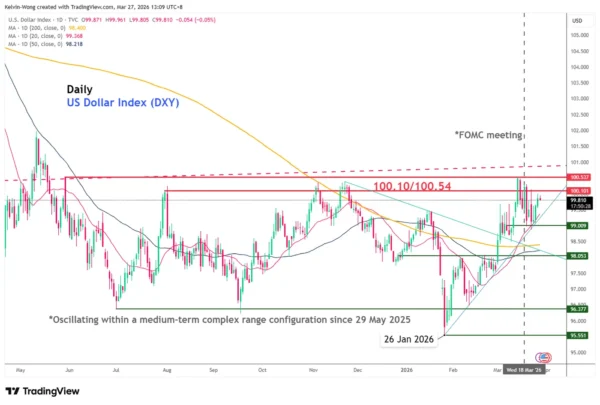
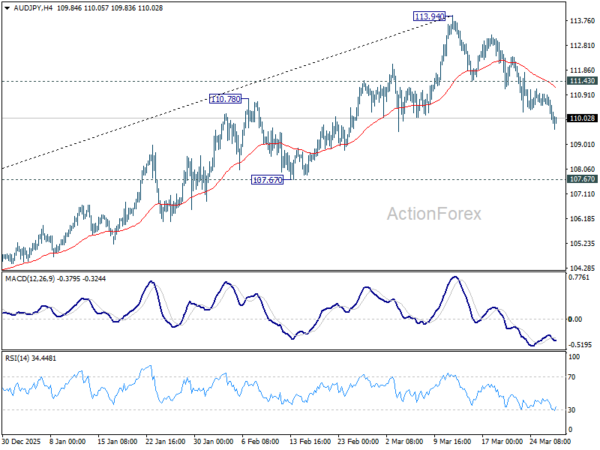
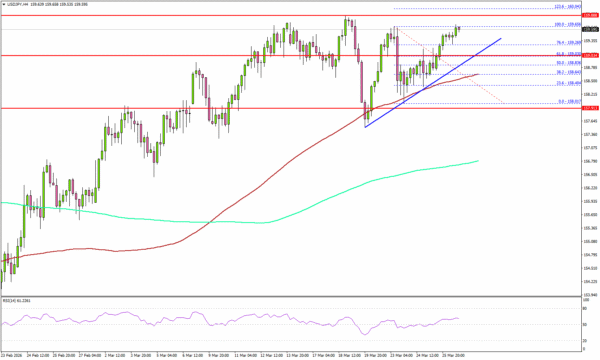
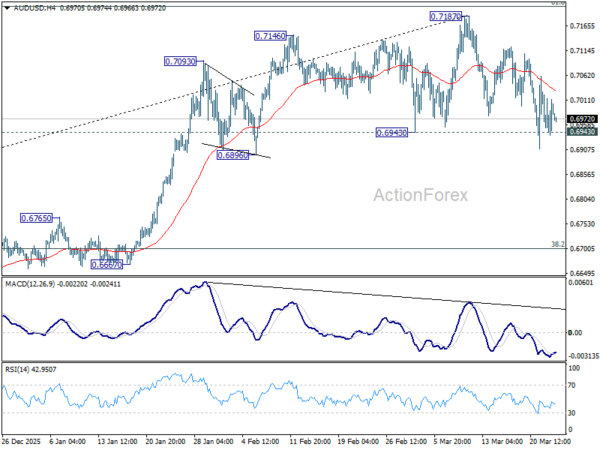
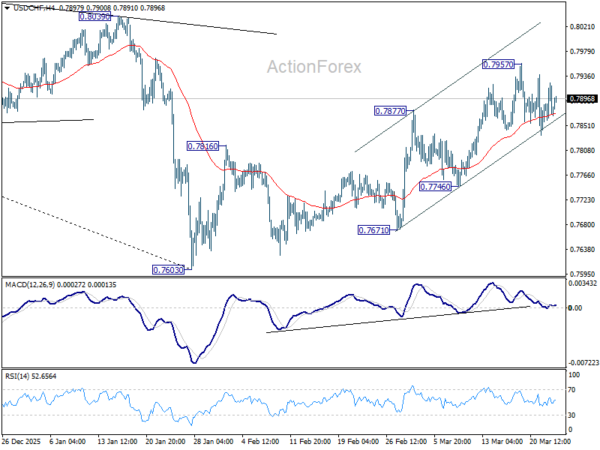
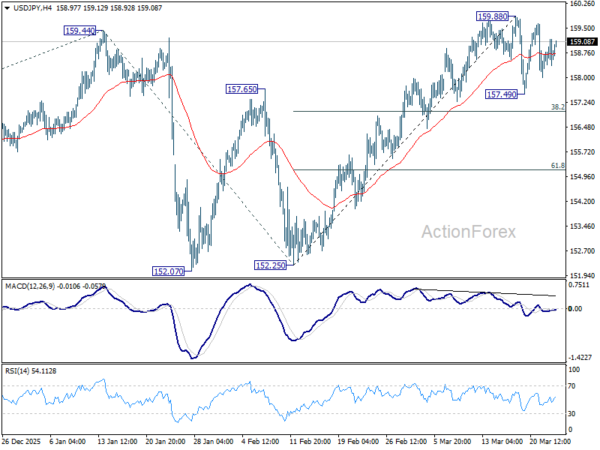
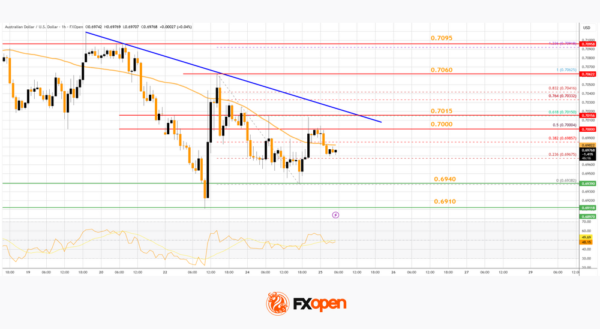
Speaking of USD, the strength of USD is keeping price action lower on precious metals, and we can see this mostly in USD/JPY, AUD/USD, where price action has smashed support, and in USD/CHF, where price action has broken resistance.
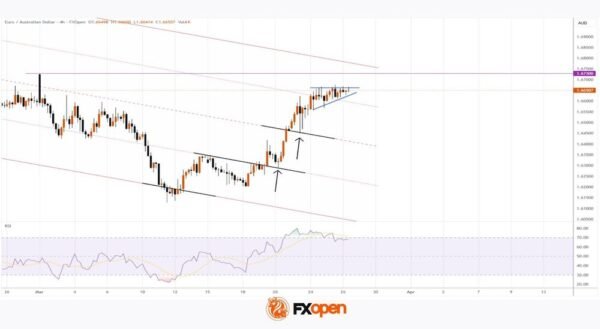
We see price action on AUD/USD breaking out of this supply zone, and it looks like we have a long way to fall.
However, if we move out to the weekly chart, we see a key level at exactly $0.69 from September of 2024.
Of course, the big news to watch is Iran, with the blockage in the Strait of Hormuz seriously affecting the price of crude oil.
Technically, we see the stochastic oscillator very overbought and turning down, and MACD seems undecided.
Again, the technicals in this market take a back seat to the fundamentals, which are changing hour by hour.
And, by the way, the spread is back up to $11.
News coming out of Washington and news coming out of Iran are completely contradictory regarding negotiations, and market speculation is rife.
As we can see, the US stock indices are still falling due to uncertainty fears regarding the Iran war and political instability in Washington.
The NASDAQ is approaching the Death Cross of the 50-Day SMA and the 200-Day SMA.
The DAX40 is actually getting closer, as we can see by the chart, and we will keep an eye on most indices in the next few weeks.