Stagflation Trap Could Tie RBA’s Hawkish Hand, and Send AUD/JPY to 103

AUD/JPY’s selloff is accelerating as renewed risk aversion combines with a growing “stagflation trap” that is undermining the Reserve Bank of Australia’s hawkish outlook. While markets still price around a 72% chance of a May rate hike, surging energy and fertilizer costs are increasingly seen as a drag on growth rather than a simple inflation boost. As expectations begin to shift, the cross is at risk of a deeper medium-term correction toward the 103 region.

The broader backdrop is turning more defensive. Escalation risks in the Middle East remain elevated, with mixed messaging from US President Donald Trump—from ultimatums to extended pauses—failing to provide clarity. Rather than calming markets, the developments have prolonged uncertainty, keeping oil prices elevated and risk sentiment fragile.

This risk-off tone is weighing directly on the Aussie as AUD/JPY has emerged as one of the clearest expressions of this shift, with the pair among the biggest movers this week and downside momentum building.

At the same time, markets are reassessing the RBA’s policy path. The central bank’s March 17 hike was delivered on a narrow 5–4 split, already signaling internal divisions. While expectations for another hike in May remain firm, confidence in that outcome is becoming more fragile as new risks emerge.

The key issue is Australia’s heavy reliance on imported refined fuels. Sustained Brent prices above 100 are feeding through into higher transport and business costs, raising inflation while simultaneously weighing on growth—a classic stagflation setup. The fertilizer shock adds extra pressure. Australia sources over 40% of its fertilizer imports from the Middle East, particularly Urea. With disruptions around the Strait of Hormuz, Urea prices have surged more than 30% in March, sharply increasing input costs for the agricultural sector. This threatens to squeeze farm margins and reduce output, while pushing food prices higher.

Taken together, these dynamics are complicating the RBA’s policy calculus. Inflation pressures argue for tightening, but the growth hit from rising costs and uncertainty raises the risk that further hikes could exacerbate the slowdown. Some market participant could start to speculate whether the balance could tilt toward a pause in May.

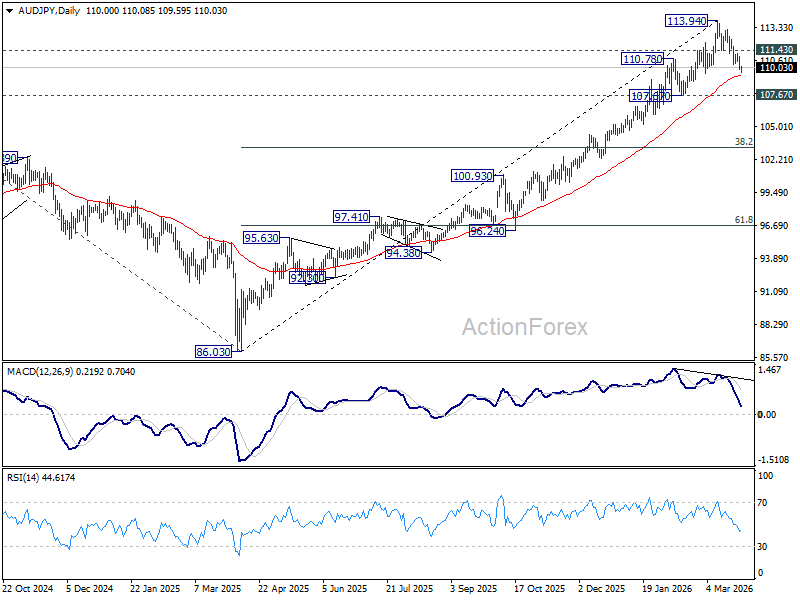
Technically, AUD/JPY is showing signs of a medium-term top, with bearish divergence visible in D MACD. The break of 110 level leaves it vulnerable, with immediate focus on the 55 D EMA (now at 109.31). Sustained trading below this level would open the door for a deeper pullback to 107.67 support next.

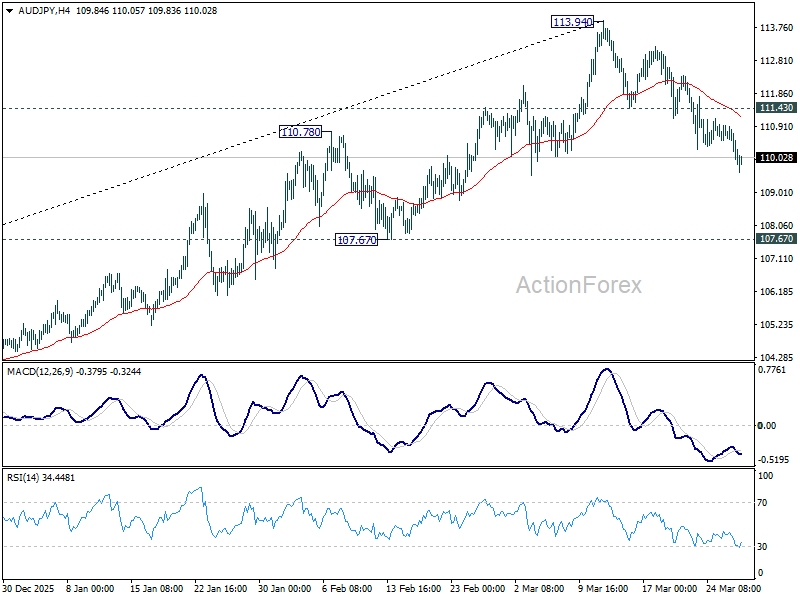
Decisive break of 107.67 will confirm that AUD/JPY is already correcting whole up trend from 86.03 (2025 low) and bring deeper decline to 38.2% retracement of 86.03 to 113.94 at 103.27.

Conversely, a strong rebound from current levels and a break above 114.30 would suggest the uptrend remains intact, though this scenario appears less likely as macro headwinds build.


Source link

Visited 1 times, 1 visit(s) today

Related Article

AUD/USD Daily Report - ActionForex

AUD/USD Daily Report – ActionForex

Daily Pivots: (S1) 0.6853; (P) 0.6907; (R1) 0.6941; More… Intraday bias in AUD/USD on the downside as this point. Fall from 0.7187 is seen as correcting the whole up trend from 0.5913. Deeper decline would be seen to 38.2% retracement of 0.5913 to 0.7187 at 0.6700. On the upside, though, above 0.6956 minor resistance will

EUR/AUD Daily Outlook - ActionForex

EUR/AUD Daily Outlook – ActionForex

Daily Pivots: (S1) 1.6651; (P) 1.6706; (R1) 1.6796; More… EUR/AUD’s rise from 1.6125 short term bottom continues today and intraday bias remains on the upside. Sustained break of 55 D EMA (now at 1.6755) will pave the way to 38.2% retracement of 1.8554 to 1.6125 at 1.7053. Nevertheless, below 1.6607 minor support will turn intraday

Trading app scams surge 1,400%: Millions of US investors at risk as trading interest soars, expert warns

Trading app scams surge 1,400%: Millions of US investors at risk as trading interest soars, expert warns

Beware of fakes and impersonations Scammers often create fake versions of popular trading platforms to trick users into sharing their personal information. With AI, these clones can be extremely convincing, replicating layouts, logos and even fake testimonials. Hence, always check the URLs carefully since scammers often use slightly altered domain names to catch careless users out.  If anything seems suspicious, change your

USD/CAD Weekly Outlook - ActionForex

USD/CAD Weekly Outlook – ActionForex

USD/CAD’s rebound from 1.3480 accelerated high last week. Initial bias stays on the upside this week for 38.2% retracement of 1.4791 to 1.3480 at 1.3981. Decisive break there will argue that it’s already reversing the whole down trend from 1.4791, and target 61.8% retracement at 1.4290. On the downside, below 1.3844 minor support will turn

EUR/GBP Weekly Outlook - ActionForex

EUR/GBP Weekly Outlook – ActionForex

EUR/GBP stayed in range trading above 0.8610 last week. Initial bias remains neutral this week first. On the upside, sustained break above 55 D EMA (now at 0.8680) will confirm short term bottoming, and bring stronger rebound back to 0.8788 resistance. However, rejection by 55 D EMA will set up another fall through 0.8611 to

GBP/JPY Weekly Outlook - ActionForex

GBP/JPY Weekly Outlook – ActionForex

GBP/JPY edged higher last week but failed to break through 213.28 resistance and retreated. Initial bias stays neutral this week first. On the upside, firm break of 213.28 will resume the rise from 207.20 to retest 214.98 high. However, break of 210.77 will bring deeper fall back to 209.15 support and below. In the bigger

USD/CHF Weekly Outlook - ActionForex

USD/CHF Weekly Outlook – ActionForex

USD/CHF’s rally from 0.7603 resumed last week by breaking through 0.7957. Initial bias stays on the upside for 38.2% retracement of 0.9200 to 0.7603 at 0.8213. For now, further rally is expected as long as 0.7833 support holds, in case of retreat. In the bigger picture, a medium term bottom should be in place at

USD/JPY Weekly Outlook - ActionForex

USD/JPY Weekly Outlook – ActionForex

USD/JPY’s rally from 152.25 resumed by breaking through 159.88 resistance last week. Initial bias remains on the upside and further rise should be seen to retest 161.94 high next. On the downside, below 159.35 minor support will turn intraday bias neutral first. But near term outlook will stay bullish as long as 157.49 support holds,

EUR/USD Weekly Outlook - ActionForex

EUR/USD Weekly Outlook – ActionForex

EUR/USD remains bounded in consolidations above 1.1408 last week and outlook is unchanged. Initial bias stays neutral this week first. Further decline is expected with 1.1666 cluster resistance (38.2% retracement of 1.2081 to 1.1408 at 1.1665) intact. On the downside, firm break of 1.1408 will resume the fall from 1.2081 to 38.2% retracement of 1.0176

AUD/USD Weekly Report - ActionForex

AUD/USD Weekly Report – ActionForex

AUD/USD’s extended decline last week should confirm medium term topping at 0.7187. Initial bias remains on the downside this week for 38.2% retracement of 0.5913 to 0.7187 at 0.6700. On the upside, above 0.6956 minor resistance will turn intraday bias neutral first. But risk will stay on the downside as long as 0.7187 resistance holds,

EUR/JPY Weekly Outlook - ActionForex

EUR/JPY Weekly Outlook – ActionForex

EUR/JPY’s rebound from 182.02 extended higher last week but retreated just ahead of 184.75 resistance. Initial bias remains neutral this week first. On the upside, break of 184.75 will resume the rise from 180.78 to retest 186.86 high. On the downside, however, below 183.17 minor support will turn bias back to the downside for 182.02

EUR/AUD Weekly Outlook - ActionForex

EUR/AUD Weekly Outlook – ActionForex

EUR/AUD’s extended rebound last week confirmed short term bottoming at 1.6125. Initial bias stays on the upside this week. Sustained break of 55 D EMA (now at 0.6756) will pave the way to 38.2% retracement of 1.8554 to 1.6125 at 1.7053. On the downside, below 1.6607 minor support will turn intraday bias neutral first. In

Quick Jumps and Fast Dives

Quick Jumps and Fast Dives

Created on March 26, 2026 Last Friday the NZD/USD was above 0.58900 a couple of times. The currency pair was within sight of the 0.61000 mark towards the end of January. On the 27th of February the NZD/USD was close to 0.60075. As of this morning the realm of 0.57860 is being seen with fast

GBP/USD Chart Alert: Bull Flag Pattern in Play Ahead of Retail Sales Data

GBP/USD Chart Alert: Bull Flag Pattern in Play Ahead of Retail Sales Data

GBP/USD is under pressure due to cautious market sentiment, USD strength stemming from Middle East ceasefire strains, and uncertainty following President Trump’s delay of Iran’s energy plant destruction. Technical analysis reveals a bull flag pattern on the H1 chart, suggesting a potential 100-pip rally If the price fails to clear the 200 SMA and breaks

GBP/USD Analysis 27/03: Pound Trades Near Fair Value (Chart)

Pound Trades Near Fair Value (Chart)

Created on March 27, 2026 British pound continues to see a lot of noisy sideways trading. British pound dropped initially during the trading session on Thursday but has turned around to show signs of life again as the market continues to bang around in a fairly well-defined range. The 200-day EMA sits right about where

USD/CAD Daily Outlook - ActionForex

USD/CAD Daily Outlook – ActionForex

Daily Pivots: (S1) 1.3820; (P) 1.3844; (R1) 1.3886; More… USD/CAD’s rally from 1.3480 is in progress and intraday bias remains on the upside. It’s seen as correcting the whole down trend from 1.4791 and should target 1.3927 resistance, or probably further to 38.2% retracement of 1.4791 to 1.3480 at 3981. On the downside, below 1.3816

L&G Asset Management global head of trading appointed global head of markets

L&G Asset Management global head of trading appointed global head of markets

Ed Wicks has been promoted to head of global markets at Legal & General Asset Management, a newly created role for the firm.   Wicks’ promotion marks an extension of his ongoing eight-year long tenure at the asset manager, having initially joined in 2015 as head of equity trading.   He later stepped up as global head

GBP/JPY Consolidates Within Ascending Trend Channel Near 212.00

GBP/JPY Consolidates Within Ascending Trend Channel Near 212.00

GBP/JPY’s month‑long sustained upside meets strong resistance. Momentum signals reflect signs of bullish exhaustion. GBP/JPY’s steady ascent within a month‑long upward‑sloping channel is showing signs of stabilisation, with price action repeatedly meeting strong resistance near the upper Bollinger band at 213.30. The broader bias remains bullish as the pair continues to trade above the long‑term

0
Would love your thoughts, please comment.x
()
x