If you are looking at Canfor and wondering whether the recent share price leaves it cheap or expensive, you are not alone. The valuation story here is what really matters.
The stock trades at C$13.11, with a 7 day return of a 4.7% decline, a 30 day return of a 16.3% decline, a year to date return of 6.1% and a 1 year return of a 12.4% decline, so recent moves have been mixed across different timeframes.
Recent news coverage around Canfor has focused on ongoing sector conditions and how lumber producers are adjusting capacity and capital plans, putting the share price moves into context for many investors. This has kept attention on whether the current market price properly reflects the company’s assets, balance sheet and long term prospects.
Against that backdrop, Canfor currently scores a 6 out of 6 on our valuation checks. We will walk through what that means across different valuation approaches, before finishing with a way to look at value that goes beyond any single model.
A Discounted Cash Flow, or DCF, model takes estimated future cash flows and discounts them back to today to arrive at an implied value per share. It is essentially asking what those future cash flows are worth in today’s dollars.
For Canfor, the model used is a 2 Stage Free Cash Flow to Equity approach. The latest twelve month Free Cash Flow (FCF) is a loss of CA$398.1 million. Analysts provide estimates out to 2027, where FCF is projected at CA$49.45 million. Simply Wall St then extrapolates further out to 2035 using those inputs and its own growth assumptions for the later years.
Bringing all those projected cash flows back to today, the model points to an estimated intrinsic value of CA$16.48 per share. Compared with the current share price of CA$13.11, this implies the shares trade at a 20.5% discount to the DCF estimate, so on this model Canfor screens as undervalued.
For a company like Canfor, where earnings can be volatile, P/S is often a useful yardstick because sales tend to be less affected by accounting items and short term profit swings. It gives you a cleaner sense of what the market is paying for each dollar of revenue.
In general, higher expected growth and lower perceived risk can justify a higher P/S multiple, while lower growth and higher risk usually line up with a lower “normal” range. That context matters when you compare Canfor’s current P/S of 0.29x with the Forestry industry average of 0.70x and a peer average of 1.57x.
Simply Wall St’s Fair Ratio for Canfor is 0.99x. This is a proprietary estimate of what the P/S could be given factors like growth expectations, profit margins, industry, market value and company specific risks. Because it blends these elements together, it can be more tailored than a simple comparison with industry or peers alone. Set against the current 0.29x P/S, the Fair Ratio suggests the shares trade below that model based reference point.
Earlier we mentioned that there is an even better way to understand valuation, so let us introduce you to Narratives.
A Narrative is simply your story about Canfor, tied directly to the numbers you care about, including what you think is a fair value and how revenue, earnings and margins might look over time.
On Simply Wall St’s Community page, Narratives let you connect that story to a clear financial forecast. This then rolls into a fair value estimate that you can compare with today’s share price to help you decide if it looks attractive, fully valued or expensive.
Because Narratives are updated automatically when new information, such as fresh earnings or news, is added, they stay current without you needing to rebuild your view from scratch. You can see how different investors might value Canfor very differently, from more cautious Narratives with lower fair values to more optimistic Narratives that sit well above the current price.
This article by Simply Wall St is general in nature. We provide commentary based on historical data and analyst forecasts only using an unbiased methodology and our articles are not intended to be financial advice. It does not constitute a recommendation to buy or sell any stock, and does not take account of your objectives, or your financial situation. We aim to bring you long-term focused analysis driven by fundamental data. Note that our analysis may not factor in the latest price-sensitive company announcements or qualitative material. Simply Wall St has no position in any stocks mentioned.
Companies discussed in this article include CFP.TO.
In 2013, Berkshire Hathaway (NYSE: BRKA)(NYSE: BRKB) partnered with the Brazilian private equity firm 3G to acquire Heinz for an enterprise value of $28 billion. Two years later, they merged Heinz with Kraft to create Kraft Heinz (NASDAQ: KHC), the company investors know today. The investment has arguably been one of Warren Buffett’s worst. Since
Will US stock market head for big crash on Monday, and will Dow Jones, S&P 500 and Nasdaq stay in red or finally turn green? Investors across global markets are watching this question after Wall Street closed lower at the end of the week. US stock market prediction, analysts insights and market outlook have gained
If you’re a U.S. stock investor, you might be feeling underwhelmed by your portfolio’s performance so far in 2026. The S&P 500 index is mostly going sideways (up 0.5% year to date), and the tech-heavy Nasdaq-100 index is down about 1.2% year to date after being hit hard by artificial intelligence (AI) fears and a
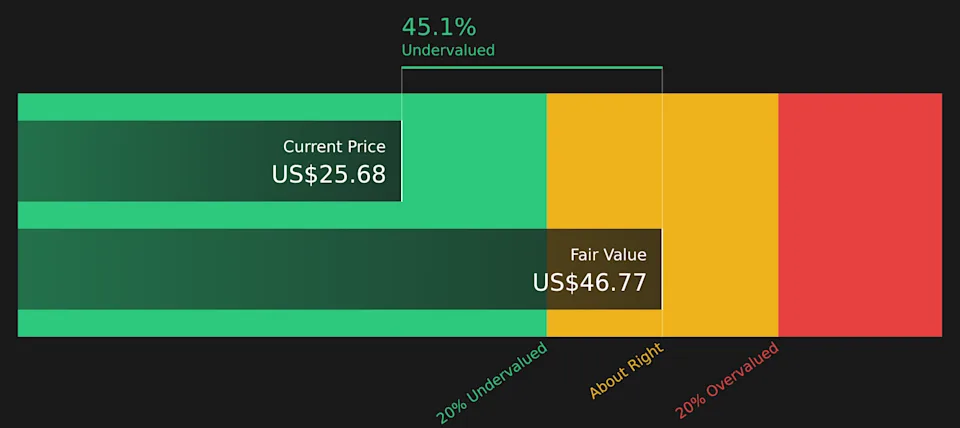
Make better investment decisions with Simply Wall St’s easy, visual tools that give you a competitive edge. If you are wondering whether Four Corners Property Trust is fairly priced or offering hidden value right now, you are not alone. The stock last closed at US$25.68, with returns of 0.6% over the past week, 3.2% over
Taiwan Semiconductor Manufacturing (TSM 4.37%), popularly known as TSMC, is a key player in the global artificial intelligence (AI) infrastructure ecosystem, manufacturing chips for all the major companies that design AI chips. This explains why TSMC stock has delivered healthy gains of 104% to investors over the past year, significantly outperforming the S&P 500‘s 15%
Have you ever forgotten to buy something while you were out at the store? In today’s world, that’s not such a big deal — after all, Amazon can have that item on your doorstep the next day. Or what about not wanting to cook once you get home because that “quick meeting” extended your time
Image source: Getty Images The stock market’s never dull, but it feels especially volatile at the moment. A rapidly-evolving situation in the Middle East means share prices are moving even more violently than usual. Sharp declines caused by temporary concerns can be buying opportunities and there are a couple of things investors can do to
For much of the last 17 years, the stock market has been virtually unstoppable. With the exception of the five-week COVID-19 crash in February-March 2020 and the nine-month bear market in 2022, the Dow Jones Industrial Average (^DJI 0.95%), S&P 500 (^GSPC 1.33%), and Nasdaq Composite (^IXIC 1.59%) have spent roughly 16 of the last
Key Points The Dow Jones Industrial Average, S&P 500, and Nasdaq Composite have delivered outsize returns during Trump’s tenure in the White House. Donald Trump’s tariff and trade policy takes a back seat to two catalysts that can trigger a stock market crash. Federal Reserve credibility and historically pricey stock valuations loom large in 2026.
Investors can’t seem to catch a break in 2026, but Jefferies says the pain should soon be over and that stocks are poised to surge. Major stock indexes fell on Friday after data from the Bureau of Labor Statistics showed the US economy lost 92,000 jobs in February, well off economists’ expectations for a gain
Investors are making the right choice by putting money to work in the stock market. Over long periods of time, it has proven itself to be a great tool at building wealth. There’s no index that’s more closely watched than the S&P 500. Luckily, investors can choose from many exchange-traded funds (ETFs) when figuring out
Image source: Getty Images The stock market has been chugging along nicely over the last few years, with both the S&P 500 and FTSE 100 hitting record highs. But with valuations getting stretched and geopolitical tensions rising, fears of a new incoming crash are starting to spread. And just last month, billionaire investor Ray Dalio
Putting together a proper strategic plan to battle the forces which many expect will impact markets on a given year is easier said than done. Indeed, we’re not even three months through this year, and we’ve already seen three major conflicts initiated by the Trump administration in foreign countries, something that hasn’t been seen in
CNBC’s Jim Cramer on Friday offered his usual game plan for the coming week on Wall Street, but he acknowledged the difficulties of peering into the future with a war unfolding in the Middle East that is disrupting oil supplies. “We obviously don’t know how long the war will last, though, and oil has a
The booth of Israeli company Elbit Systems at the Paris Air Show at Le Bourget airport, June 16, 2025. BENOIT TESSIER / REUTERS On Wednesday, March 4, the defense company Elbit Systems became the highest-valued company listed on the Tel Aviv Stock Exchange following a further 5% surge in its share price. Its market capitalization
Find winning stocks in any market cycle. Join 7 million investors using Simply Wall St’s investing ideas for FREE. If you have been wondering whether Grab Holdings at around US$3.98 is a bargain or a value trap, you are not alone. This article is designed to help you frame that question clearly. The stock is
Get insights on thousands of stocks from the global community of over 7 million individual investors at Simply Wall St. BHP Group now carries an updated fair value estimate of A$51.98, compared with A$51.72 previously, refining how analysts are recalibrating their price targets. Across London, Australia and the U.S., recent target moves in US$ and
Source: Getty Images Written by Karen Thomas, MSc, CFA at The Motley Fool Canada A stock market crash is a sudden and dramatic drop in the value of stocks. Throughout the history of stock markets, there have been quite a few stock market crashes. This is the nature of stock markets and is to be
Robinhood (HOOD) wants to capture the next generation of investors before they can crawl. Speaking directly to President Trump at a White House summit regarding the “Trump Accounts” Initiative, Robinhood CEO Vladimir Tenev said the trading platform is “ready to support the program.” The company possesses the “resources and people that can do whatever is
Barely a week after posting record numbers for 2025, shares of Newmont (NYSE: NEM) are getting punished. The gold stock plunged this week, dropping 13% at its lowest point in trading through 11 a.m. ET Friday. You’d expect the price of gold, a “safe haven” asset, to rise amid the ongoing conflict in the Middle