Polymarket Thinks Bitcoin Will Hit $75,000 Next Week, But Charts Disagree
Bitcoin price has traded mostly flat over the past 24 hours near $68,000, reflecting continued indecision. The broader seven-day trend still shows a mild decline, highlighting the lack of strong bullish momentum. Yet one prediction market’s positioning is telling a far more optimistic story.
On Polymarket, the single largest February outcome, at 17%, expects Bitcoin to cross $75,000. This makes it the most popular directional bet as the month approaches its final week. However, market structure, on-chain activity, and whale positioning suggest reality may not align with this bullish expectation.
Prediction market data shows ‘above $75,000’ remains the most favored February target despite weakening sentiment. Polymarket volumes, for this bet, exceed $88 million, with millions in active liquidity.
However, the probability of the $75,000 outcome has already declined by more than 50%, reflecting fading confidence.
Biggest Polymarket Number For BTC: Polymarket
At the same time, the next most likely outcome sits at ‘under $60,000’ with a 12% probability. This positioning reveals a growing split in expectations. While many traders still hope for upside, a large portion of the market is increasingly preparing for a deeper correction instead.
Key BTC Price Levels: Polymarket
This growing caution aligns closely with Bitcoin’s technical structure.
On the daily chart, Bitcoin formed a lower high between November 15 and February 16. This means price failed to fully recover during its latest rally attempt.
Meanwhile, the Relative Strength Index (RSI), which measures momentum strength, formed a higher high during the same period.
Bearish Divergence: TradingView
Want more token insights like this? Sign up for Editor Harsh Notariya’s Daily Crypto Newsletter here.
Because Bitcoin was already in a downtrend, this creates a hidden bearish divergence. This pattern usually signals continuation of the existing downtrend rather than a bullish reversal. It shows that even though momentum improved briefly, the broader selling pressure remains intact.
Since this divergence appeared, Bitcoin has already corrected nearly 6%. As long as this signal remains active, the probability of reaching the prediction market’s $75,000 target remains limited.
Long-term holder activity helps explain why prediction markets still retain some optimism, even as risks increase. These investors may have held Bitcoin for more than 1 year. Their buying and selling patterns often determine whether Bitcoin enters a sustained rally or correction.
On February 5, long-term holders reduced their holdings by 244,919 BTC (30-day rolling change), a sign of extremely heavy selling. By February 21, this number improved to 81,019 BTC. This marks a roughly 67% reduction in selling pressure.
Long-Term Holders: Glassnode
This sharp slowdown in selling helps stabilize Bitcoin’s price and explains why some traders still expect upside.
However, long-term holders are still net sellers overall. They have not yet transitioned into accumulation. Their activity has improved, but they are not yet providing the strong buying support needed to push Bitcoin toward new highs.
This creates a neutral balance. Bitcoin may avoid immediate collapse, but it also lacks the strength needed for a major breakout to push it close to $75,000.
Whale positioning further reflects uncertainty.
The largest Bitcoin whales, holding between 100,000 and 1 million BTC, increased their holdings from 676,540 BTC to 690,000 BTC. This represents an accumulation of about 13,460 BTC, signaling cautious buying.
However, smaller whales holding between 10,000 and 100,000 BTC reduced their holdings from 2.27 million BTC to 2.26 million BTC. This means roughly 10,000 BTC were sold during the same period.
This opposing behavior shows a lack of unified conviction, even though the net balance slightly tilts towards accumulation. Some whales are preparing for a rebound, while others remain defensive.
BTC Whales: Santiment
At the same time, cost basis distribution data reveals a major resistance cluster between $72,600 and $73,200. Around 149,000 BTC were accumulated in this range. These levels also appear clearly on the price chart as a major resistance zone just below $75,000.
Bitcoin Cost Basis On The Upside: Glassnode
When Bitcoin approaches this area, many holders may sell to exit at breakeven. And the whale accumulation strength, as seen, isn’t strong enough to absorb the supply yet. This selling pressure creates a strong barrier that prediction markets may be underestimating.
Bitcoin’s price structure closely aligns with these on-chain cost basis clusters.
To reach the $75,000 prediction target, Bitcoin must first break above $72,200. This level represents both technical resistance and is close to one of the largest cost basis clusters on the chart. Breaking this zone would require a rally of more than 6% from current levels.
However, failure to break this resistance increases the likelihood of continued range-bound movement. On the downside, strong support exists between $64,300 and $63,800, where approximately 150,000 BTC were accumulated.
On the Bitcoin price chart, the key support level resembling the zone is $63,300, breaking which would also mean the supply cluster break. Breaking under $63,300 can make the $60,000 zone, the 12% probability bet on Polymarket, come to fruition.
Cost Basis On The Downside: Glassnode
As a result, Bitcoin is currently trapped between two major cost basis zones. Resistance near $72,200 limits upside, while support near $63,300 prevents immediate collapse.
Bitcoin Price Analysis: TradingView
This range-bound structure suggests that prediction markets may be overestimating the probability of a breakout toward $75,000 while underestimating the growing risk of continued consolidation or a correction.
Healthcare is one of the most lucrative industries where investors can find world-class businesses to buy and hold. Industry leaders can be unstoppable long-term wealth creators, though there’s no such thing as a perfect stock. Novo Nordisk (NYSE: NVO) and Zoetis (NYSE: ZTS) have taken their share of lumps recently. Still, each company pays its
Microsoft (NASDAQ: MSFT) has had a rough 2026. Its stock is down over 25% from its October highs, with the majority of that decline occurring in 2026. It’s not often you see a well-established tech player like Microsoft decline so much, and it’s even more rare to see it occur for no obvious reason. This
A house fire broke out Saturday night on Southeast Murray Terrace, forcing a family out of their home and killing one of their dogs. Crews rushed to the single-family home at 11:38 p.m. after getting reports of a fire. When firefighters arrived, they saw heavy flames coming from the front of the house. >>> STREAM
The European Union’s planned landmark trade deal with the United States is once again in jeopardy, as the fallout from a Supreme Court ruling against President Donald Trump’s sweeping tariffs continues to ripple across global trade negotiations. US President Donald Trump at an event at the White House. Rather than accept the ruling and go
From the 1890s through the World War II, battleships ruled the waves. These steel leviathans projected naval power across all the world’s seas, clashing with other ships or bombarding enemy forces onshore with their giant guns. However, by the 1940s, battleships were becoming obsolete. While some other classes of warships built for World War II are
Buying a car is one of the biggest financial decisions most Americans will ever make, right up there with buying a home, except you can’t live in a Honda Civic. (Well, technically you can, but that’s a different article.) The good news: Consumer Reports has done a lot of the heavy lifting for you. Drawing
NEED TO KNOW Vicki Purdey, from Dorset, England, was diagnosed with a life-altering illness after her flu-like symptoms worsened “Over a few days, I just felt worse and thankfully, my mom was there to call the ambulance,” she recalled Purdey, 37, is now reliant on a wheelchair while also suffering from brain fog and frequent
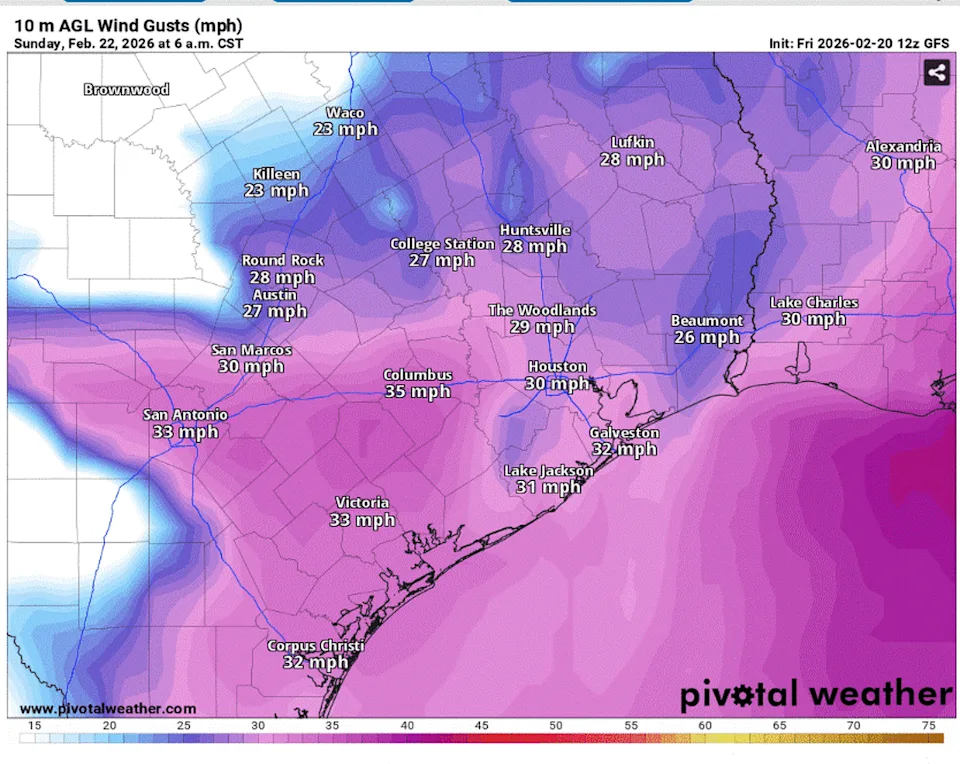
Our latest cold front, having swept through Central Texas and shifted east, has left behind a noticeable change in the air. A seasonably cooler, more winter-appropriate air mass has taken over, with morning temperatures back in the 30s and 40s and afternoons only in the 60s on Sunday. The only drawback of this latest front
Weeks after authorities crushed deadly anti-government protests that had rocked Iran, students in the country again chanted slogans on Saturday in the latest display of outrage against the clerical regime. The gatherings at universities came after a mass protest movement last month that was met with a government crackdown that left thousands dead. (X via
President Trump demanded that Netflix kick former national security adviser Susan Rice off its board, adding another political headache to the streaming company’s pursuit of Warner Bros. Discovery’s key entertainment assets. President Trump demanded that Netflix kick former national security adviser Susan Rice off its board “Netflix should fire racist, Trump Deranged Susan Rice, IMMEDIATELY,
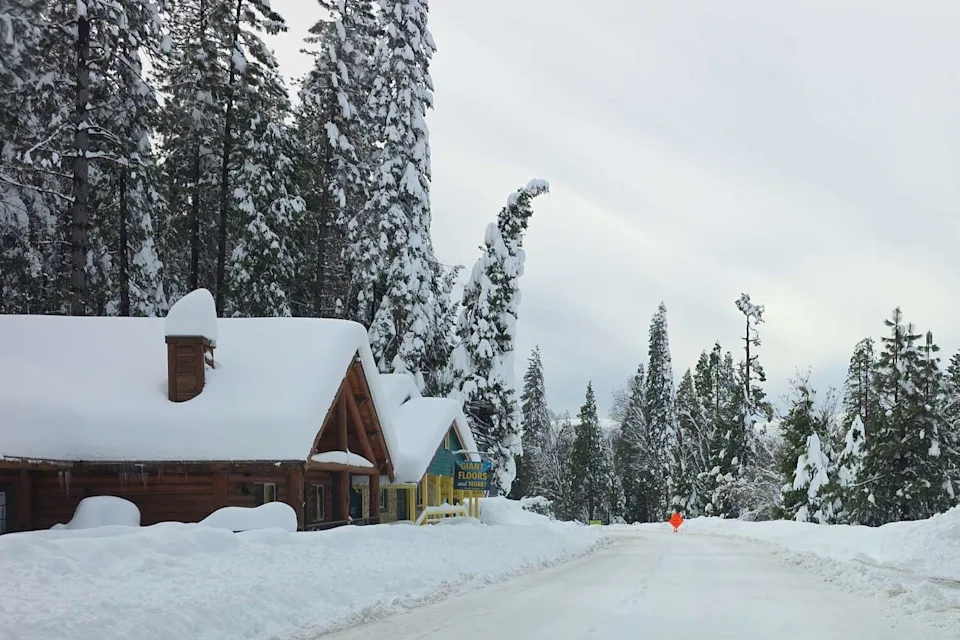
Thousands of people lost power in the Sierra foothills this week, with many snowbound by a storm that blanketed some areas in more than 10 feet of new snow. But the conditions have done little to stem the flow of “snowplayers” – weekend visitors from the Bay Area or Central Valley who travel to the mountains
Peer into The Economist’s decision-making processes with Edward Carr, our deputy editor, who explains how we select and design our front cover. Cover Story shares preliminary sketches and documents the—often spirited— debates that lead each week to a design seen by millions of people. In Europe, on the eve of the fourth anniversary of Russia’s
Tehran’s crackdown on protesters and minority groups has intensified as the regime faces mounting pressure both domestically and internationally. Iranian President Masoud Pezeshkian stated on Saturday that his country would not yield to pressure from global powers during ongoing nuclear talks with the United States. “World powers are trying to force us into submission… but
Smithfield Foods, Inc. (NASDAQ:SFD) is among the 11 Best High Growth Consumer Stocks to Buy Right Now. Smithfield Foods, Inc. (SFD) Announces it Initiated the Approval Process to Build a New Packaged Meats and Fresh Pork Processing Facility On February 16, 2026, Smithfield Foods, Inc. (NASDAQ:SFD) announced it had initiated the approval process to build
Islamabad said on Sunday it carried out strikes on seven sites along the Pakistan-Afghanistan border, targeting Afghan-based militant groups it blames for recent suicide attacks. The ministry said the strikes were in response to a suicide bombing at a Shiite mosque in Islamabad two weeks ago. (Representative Image/Reuters) In a statement, the Ministry of Information
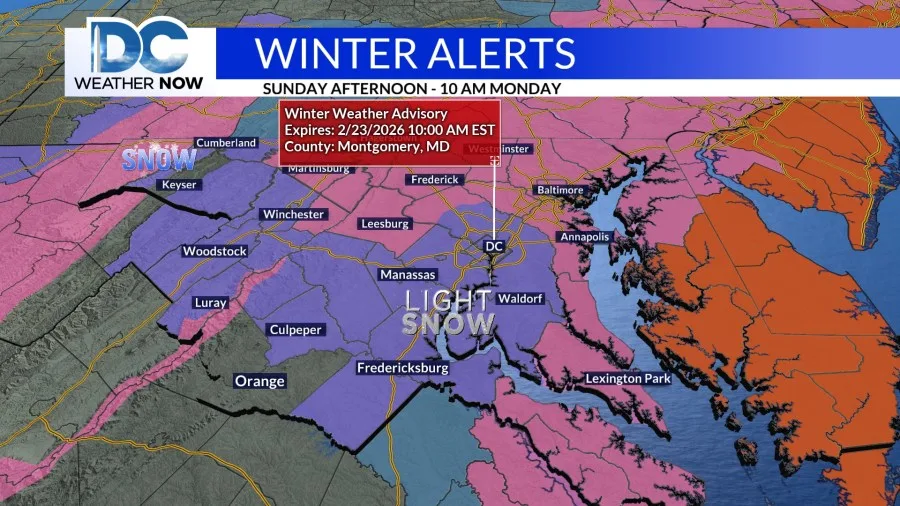
Good Saturday, Everyone! The DC NewsNow weather team has issued another DMV first warning for the area, effective through Sunday afternoon and evening, and into Monday morning. More snow is on the way, with the greatest accumulation occurring further north and east of D.C. Tonight will be quiet, with just increasing clouds through midnight, but
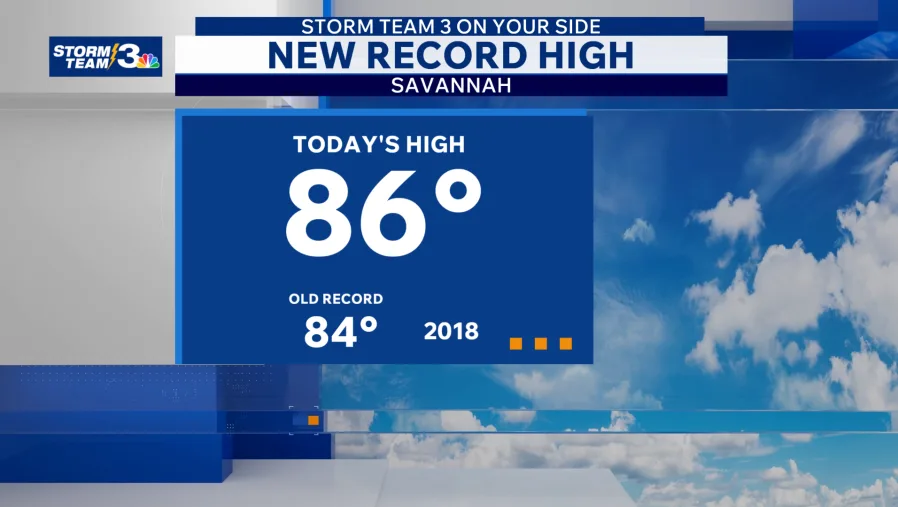
SAVANNAH, Ga. (WSAV) — Showers and storms continue overnight, followed by a return to wintry temperatures. Saturday was another warm and breezy day before showers and storms moved in. Savannah/Hilton Head International Airport recorded a new daily record high of 86°, breaking the old record of 84° set back in 2018. Winds gusted over 30
An Amber Alert was issued Feb. 21 for a missing 3-year-old girl last seen in Avondale. Kehlani Rogers was last seen around 11:30 p.m. Feb. 20 at her home near 118th Avenue and Edgemont Avenue, according to a missing person’s flyer from the Avondale Police Department. Rogers is described as a Black girl, about 3
The overall market may still look overbought and feel overvalued. But a handful of stocks have actually lost some ground of late, even if they didn’t deserve to. With that as the backdrop, here’s a rundown of three of them worth buying while you can still get them at a discount. Where to invest $1,000
Five officers claimed to have resigned from Reform UK in Kirklees (Image: Christopher Furlong, Getty Images) Reform UK has hit back after five officers from branches across Kirklees claimed to have resigned from the party. A Facebook page dedicated to Reform branches in Ossett & Denbury Dale and Dewsbury & Batley announced that all five