Gold is Getting Cheaper, But It Is Not Critical

Gold on Monday fell to 4980 USD per ounce after rising more than 2% in the previous session. The volatility was driven by weaker-than-expected US inflation data.

Soft CPI data has boosted expectations of a Fed rate cut this year, and the market is now pricing in just over two cuts. Investors’ focus was on the publication of the FOMC minutes, a preliminary estimate of US GDP and PCE inflation data. All of them could clarify the timing of the regulator’s next move.

On the geopolitical front, attention is focused on the nuclear negotiations between the US and Iran, as well as the resumption of consultations on Tuesday to address the conflict involving Russia. These events could further affect risk appetite and demand for defensive assets.

Despite the current correction, gold remains supported by geopolitical uncertainty, continued purchases by central banks, and capital flows from sovereign bonds and currencies.

Technical Analysis

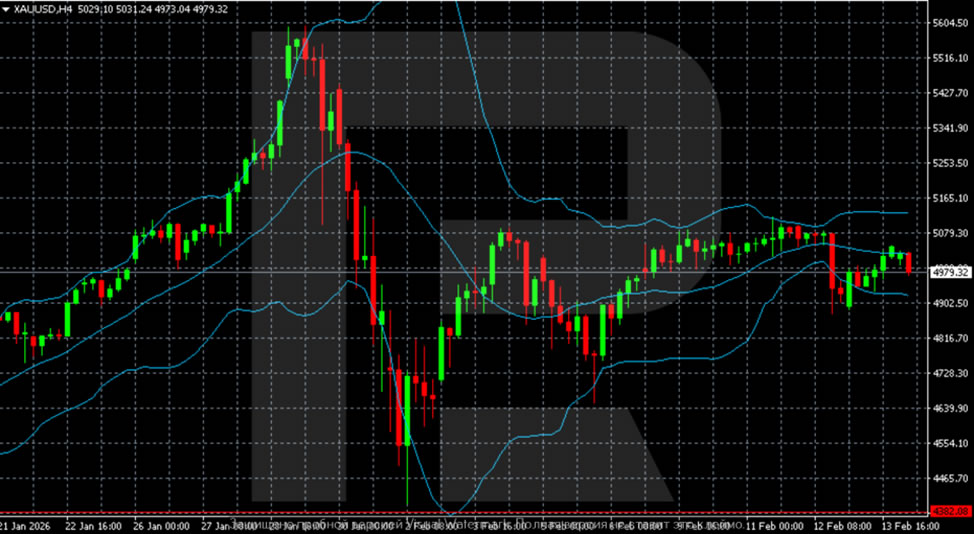
The H4 time frame for gold shows a transition after a sharp decline from the zone above 5500 USD to the consolidation phase. The price is held around 4980–5050, moving along the median line of the Bollinger Bands. Volatility has decreased noticeably, with a range forming. Key support stands at 4900–4920 USD, resistance at 5050–5100 USD.

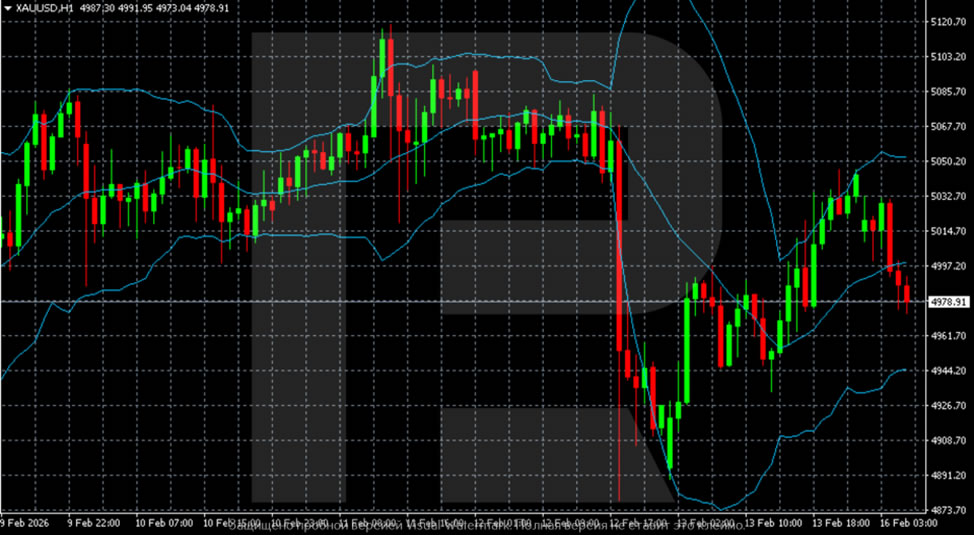
The H1 chart shows a sharp drop to 4880 USD, followed by a rebound. Now the price is again testing the area 4970-4990 USD. The Bollinger Bands are narrowing – the market is bracing for another move. Pinning above 5000 USD will open the way to 5050 USD; the loss of 4950 USD will increase pressure towards 4900 USD.

Conclusion

In summary, gold’s modest pullback represents a healthy consolidation following an aggressive rally triggered by softer US inflation data. The fundamental backdrop remains constructive, with renewed Fed easing expectations, sustained central bank buying, and geopolitical tensions providing underlying support. Technically, the price is compressing within a narrowing range, signalling an imminent directional move. The critical threshold remains the psychological 5000 level: reclaiming it would target 5050 USD resistance, while sustained weakness below 4950 USD could open a retest of 4900 USD support. With key US data and geopolitical events looming, gold is poised for its next significant move.

Source link

Visited 1 times, 1 visit(s) today

Related Article

GBP/USD Enters Consolidation Phase; USD/CAD Strengthens

GBP/USD Enters Consolidation Phase; USD/CAD Strengthens

GBP/USD started a downside correction from 1.3700. USD/CAD is gaining bullish momentum and might clear 1.3640 for more upside. Important Takeaways for GBP/USD and USD/CAD Analysis Today The British Pound rallied toward 1.3700 before the bears appeared. There is a declining channel forming with support near 1.3585 on the hourly chart of GBP/USD at FXOpen.

USD/JPY: Bears Take a Breather After Almost 3% Weekly Drop

USD/JPY: Bears Take a Breather After Almost 3% Weekly Drop

USDJPY bounced on Monday on partial profit taking after last week’s almost 3% drop (the biggest weekly loss since Nov 2024). Weaker dollar and growing optimism after PM Takaichi’s election victory, contributed to fresh strength of Japanese currency last week. Recovery attempts were so far repeatedly capped by initial Fibo barrier at 153.54 (23.6% of

Silver Plays Its Own Game

Silver Plays Its Own Game

Precious metals are diverging due to different market structures. Dollar under pressure before US GDP and EU business activity releases. The slowdown in US CPI from 2.7% to 2.4% has halted the advance of the US dollar. If inflation returns to its 2% target without a recession, the Fed will not need to keep rates

image

BTC/USD Forex Signal 16/02: Resistance at $71,762 (Chart)

Created on February 16, 2026 My previous BTC/USD signal on 9th February was not triggered. Today’s BTC/USD Signals Risk 0.50% per trade. Trades may only be entered before 5pm Tokyo time Tuesday. Long Trade Ideas Go long after a bullish price action reversal on the H1 timeframe following the next touch of $66,773, $65,786, $61,229,

NZDUSD Validates Blue Box Strategy, Offers Buy Setup

NZDUSD Validates Blue Box Strategy, Offers Buy Setup

In this technical blog, we will look at the past performance of the 1-hour Elliott Wave Charts of NZDUSD. In which, the rally from 21 November 2025 low is unfolding as an impulse & showed a higher high sequence therefore, called for an extension higher to take place. We knew that the structure in NZDUSD

Eurozone industrial output contracts -1.4% mom in December, capital goods drag

Eurozone industrial output contracts -1.4% mom in December, capital goods drag

Eurozone industrial production fell -1.4% mom in December, slightly better than expectation of -1.5% mom, but still signaling weak momentum into year-end. . By category, capital goods output in Eurozone dropped sharply by -1.9%, highlighting fragile business investment conditions. Production of intermediate goods edged down -0.1%, energy slipped -0.3%, and non-durable consumer goods fell -0.3%.

USD/JPY Daily Outlook - ActionForex

USD/JPY Daily Outlook – ActionForex

Daily Pivots: (S1) 152.31; (P) 152.99; (R1) 153.38; More… Intraday bias in USD/JPY remains neutral for the moment. With 38.2% retracement of 139.87 to 159.44 at 151.96 intact, price actions from 159.44 are seen as a consolidations pattern only. On the upside, firm break of 154.63 minor resistance will bring stronger rebound towards 157.65. However,

Cboe Silexx enhances equities display, symbol column sorting

Cboe Silexx enhances equities display, symbol column sorting

Cboe Silexx, a multi-asset order execution management system (OEMS) that caters to the professional marketplace, has announced the release of version 26.3. Closing Price | Current Day Closing Price Display Equities now display the current day’s official closing price in a new Close column across multiple modules including: Order Ticket’s Quote Panel Portfolio Watchlist Risk

EUR/USD At Pivotal Juncture As Sellers Guard Resistance

EUR/USD At Pivotal Juncture As Sellers Guard Resistance

Key Highlights EUR/USD found support at 1.1765 and corrected some losses. A key bullish trend line is forming with support at 1.1850 on the 4-hour chart. GBP/USD is consolidating above the 1.3600 support. Gold prices could resume upside if there is a move above $5,150. EUR/USD Technical Analysis The Euro dipped below 1.1800 against the

Weekly Forex Forecast - 16th to 20th February 2026 (Charts)

Weekly Forex Forecast – 16th to 20th February 2026 (Charts)

I wrote on the 8th February that the best trades for the week would be: Long of the Dow Jones Industrial Average. This gave a loss of 1.09% over the week. A summary of last week’s most important data in the market: US CPI (inflation) – this came in just a fraction lower than expected,

The US GDP, PCE and FED Minutes Add Further Intrigue This Week

Forex Signals Feb 16: Walmart, BHP, Moody’s, DoorDash and Palo Alto Earnings Preview

A diverse group of global heavyweights—including Walmart, BHP, and Palo Alto Networks—are set to report earnings, offering fresh insight. Written by: Skerdian Meta • Sunday, February 15, 2026 • 5 min read • Last updated: Sunday, February 15, 2026 Add an article to your Reading List Register now to be able to add articles to

GBP/USD Weekly Forecast - 15/2: Market Look Upwards? (Chart)

GBP/USD Weekly Forecast – 15/2: Market Look Upwards? (Chart)

Created on February 15, 2026 When the GBP/USD begins trading tomorrow it will take place under a cautious banner which has produced rather choppy results the past month. The currency pair is still within its long-term higher realm, but below its apex values achieved in late January when the 1.38500 was challenged. However, as the

USD/INR exchange rate analysis showing interim trade deal impact on Indian rupee gains

How the Interim Trade Deal Curbing Rupee Gains Impacts 2025 Markets

BitcoinWorldUSD/INR Exchange Rate: How the Interim Trade Deal Curbing Rupee Gains Impacts 2025 Markets NEW DELHI, March 2025 – The USD/INR currency pair enters a critical phase as analysts from Mitsubishi UFJ Financial Group (MUFG) highlight a significant constraint. According to their latest assessment, the recently negotiated interim trade deal between the United States and

EUR/AUD Weekly Outlook - ActionForex

EUR/AUD Weekly Outlook – ActionForex

EUR/AUD’s decline resumed last week and hit 1.6620, but recovered since then. Initial bias remains neutral this week for consolidations. Outlook will stay bearish as long as 1.7060 resistance holds. Break of 1.6620 will resume larger down trend from 1.8554 to 138.2% projection of 1.8554 to 1.7245 from 1.8160 at 1.6351 next. However, firm break

USD/JPY Weekly Outlook - ActionForex

USD/JPY Weekly Outlook – ActionForex

USD/JPY fell sharply last week but the decline lost momentum ahead of 152.07 support. Intial bias stays neutral this week first. With 38.2% retracement of 139.87 to 159.44 at 151.96 intact, price actions from 159.44 are seen as a consolidations pattern only. On the upside, sustained break of 55 4H EMA (now at 154.51) will

EUR/JPY Weekly Outlook - ActionForex

EUR/JPY Weekly Outlook – ActionForex

EUR/JPY fell sharply last week but the declined stalled after hitting 38.2% retracement of 172.24 to 186.86 at 181.27. Initial bias is neutral this week first. On the downside, sustained break of 181.27 will argue that fall from 186.86 is correcting whole up trend from 154.77. Next near term target will be 161.8% projection of

USD/CHF Weekly Outlook - ActionForex

USD/CHF Weekly Outlook – ActionForex

USD/CHF stayed in consolidations from 0.7603 last week. Initial bias stays neutral this week first. Stronger rebound cannot be ruled out but upside should be limited by 55 D EMA (now at 0.7861) to complete the pattern. On the downside, break of 0.7603 will resume larger down trend, and target 0.7382 projection level next. In

EUR/USD Weekly Outlook - ActionForex

EUR/USD Weekly Outlook – ActionForex

EUR/USD’s rebound stalled after hitting 1.1928 last week and retreated. Initial bias stays neutral this week first. On the upside, above 1.1928 will target a retest on 1.2081 high. Decisive break there and sustained trading above 1.2 psychological level will carry larger bullish implications. On the downside, however, sustained trading below 55 D EMA (now

EUR/GBP Weekly Outlook - ActionForex

EUR/GBP Weekly Outlook – ActionForex

EUR/GBP edged higher last week but failed to break through 0.8744 resistance. Initial bias remains neutral this week first. Firm break of 0.8744 will indicate that fall from 0.8863 has completed as a correction. Further rally should then be seen back to retest 0.8863 high. On the downside, sustained break of 38.2% retracement of 0.8221

0
Would love your thoughts, please comment.x
()
x