GBP/USD Weekly Forecast – 18/01: Lower Trend? (Chart)

Traders of the GBP/USD will have to decide on their personal perspectives while judging technical, fundamental and behavioral sentiment this coming week.

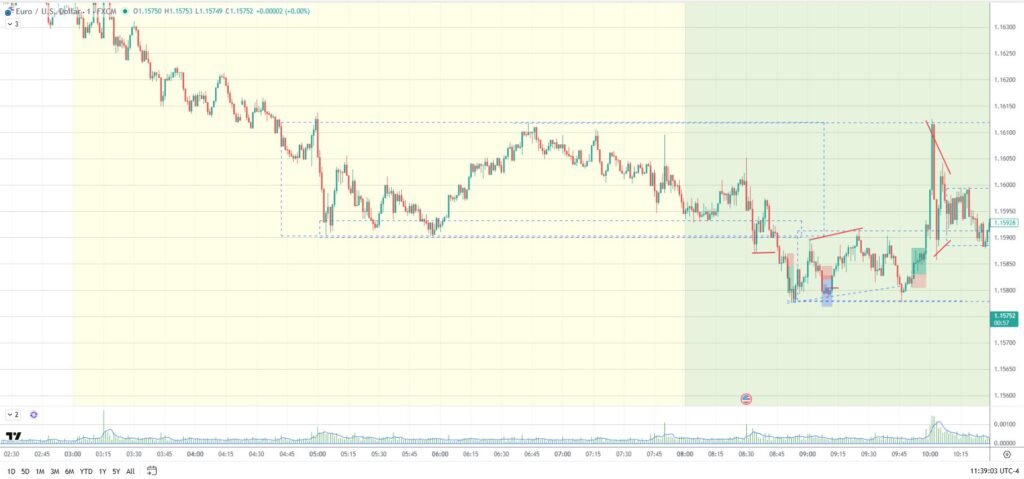
On the 6th of January the GBP/USD was at nearly 1.35680. Last Tuesday the GBP/USD was around 1.34955 as the high for the week, but the currency pair closed close to 1.33764 going into this weekend. The incremental lower action since the highs made in the first week of January do correlate to the broad Forex markets.

The highs seen on the 6th of January touched values last seen in September of 2025, but remained far below the apex highs attained then and in the month of June when the 1.37000 value was penetrated. However, the recent lower price action in the GBP/USD is still within the lower middle crux of the currency pair’s value via a one month chart. And near higher elements when a GBP/USD three month technical glance is taken.

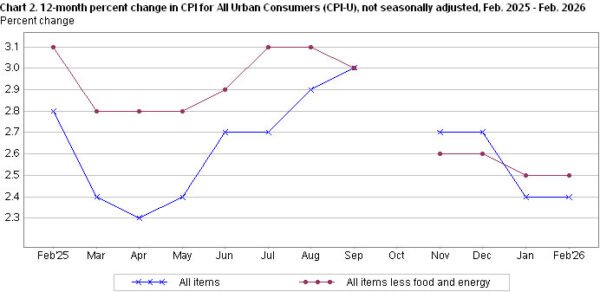
The U.K still is producing rather lackluster economic data, this Tuesday employment data will come from Britain, and inflation via CPI statistics will be published on Wednesday. Yet, U.S data and influence via USD centric action remains the dominant force with the GBP. U.S economic data via its inflation statistics were rather mixed, but the most recent releases (October and November data were released last week at the same time due to the U.S government shutdown a couple of months ago) showed inflation remained rather tame – this if you looked at the November results.

GBP/USD Weekly Forecast - 18/01: Lower Trend? (Chart)

However, this point can be argued and certainly did not impact the USD with weakness. In fact the USD got stronger and the downwards price of action of the GBP/USD and the EUR/USD reflected this trend. It can be said that more risk adverse attitudes in the financial markets caused the selloff of the GBP/USD, which picked up moment from late Tuesday and into the remainder of the week. The close of nearly 1.33764 is traversing territory last seen around the 19th of December.

The U.S Federal Reserve is suffering from a rather public debate in its FOMC about the direction of interest rates. Fed Chairman Jerome Powell and President Trump are engaged in a rather unprecedented tussle regarding policy.

  • The firefight President Trump is trying to start with the Fed may have financial institutions rather nervous about short and near-term effects on the USD.
  • The Fed will conduct its next FOMC meeting the end of January, and not many analysts are predicting a rate cut in this upcoming meeting.
  • Also the threat of escalating tension in the Middle East due to the Iranian situation has likely increased nervousness with financial institutions, this as they look forward and deal with near-term commercial cash positions.

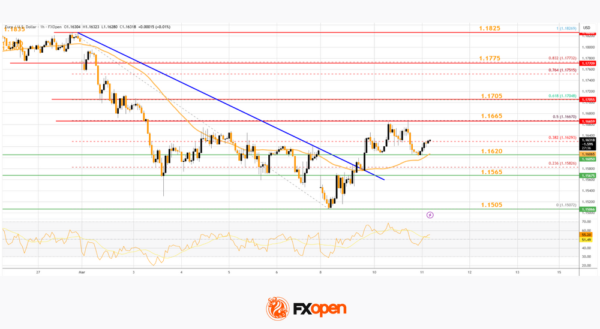
Speculative price range for GBP/USD is 1.32950 to 1.35020

Day traders and financial institutions may both feel that the GBP/USD is oversold at its current levels, but nervous sentiment early this coming week should be watched. Depending on news developments the USD could see rather volatile price action due to rhetoric which could influence sentiment rather dramatically in the near-term. If global conditions remain tranquil this could help ease tensions among large institutions, but this doesn’t feel likely. This weekend has produced loud noise regarding threats of more tariffs against Europe due to political diatribes from President Trump about Greenland once again, yes, believe it or not. Thus, large traders are getting hit from many directions regarding noise in the markets.

Also it should be remembered that President Trump is scheduled to speak in the middle of this week at the Davos summit in Switzerland. Trump could engage in a calm tranquil policy speech, or he could easily veer off into rhetoric which makes financial markets nervous. If nervousness wins the day, this could create downwards trajectory for the GBP/USD. Although the GBP/USD may be thought of as being oversold for the moment, looking for sustained upside this coming week may be difficult. Short, quick hitting wagers are recommended for day traders depending on the their perspectives and sentiment shifts which are a certainty.

Ready to trade our weekly forecast? Check out the best forex trading company in UK worth using.

Source link

Visited 1 times, 1 visit(s) today

Related Article

Elliott Wave Perspective: Assessing Oil’s (CL) Upside Amid War-Driven Volatility

Elliott Wave Perspective: Assessing Oil’s (CL) Upside Amid War-Driven Volatility

The short-term Elliott Wave outlook in Crude Oil (CL) indicates that the cycle from the December 16, 2025 low has advanced as a five-wave impulse. From that low, wave (1) concluded at $66.48, followed by a corrective pullback in wave (2) which ended at $61.12. The commodity then resumed its upward trajectory in wave (3),

Market maker Virtu expands OTC crypto pricing via new Talos partnership

Market maker Virtu expands OTC crypto pricing via new Talos partnership

Leading principal market maker Virtu Financial Inc (NYSE:VIRT) has announced that it has integrated with Talos, a provider of institutional digital asset infrastructure, technology and data supporting the full investment lifecycle. With this integration, Virtu is now streaming spot digital asset liquidity to institutional clients through the Talos platform. With more than 17 years of

Image for representation

Rupee falls 4 paise to 91.89 against U.S. dollar in early trade

Image for representation | Photo Credit: Getty Images The rupee fell 4 paise to 91.89 against U.S. dollar in early trade on Wednesday (March 11, 2026) weighed down by FII outflows and the unrelenting conflict in the Middle East. However, a weaker greenback and falling global crude oil prices prevented sharper loss in the local

S&P 500 Fluctuates Ahead of CPI Report

S&P 500 Fluctuates Ahead of CPI Report

As the S&P 500 chart (US SPX 500 mini on FXOpen) shows, the index is trading near the 6,800 level this morning. However, the balance between supply and demand could change significantly after the release of the Consumer Price Index (CPI) report scheduled for 15:30 GMT+3. Against the backdrop of military developments in the Middle

US CPI steady at 2.4% in February, core unchanged at 2.5

US CPI steady at 2.4% in February, core unchanged at 2.5

US inflation rose slightly faster than expected in February, though the broader price trend remained stable. Headline CPI increased 0.3% mom, above the expected 0.2% rise, while core CPI—which excludes food and energy—rose 0.2% on the month, matching market expectations. Housing costs continued to play the largest role in the monthly increase. The shelter index

EUR/USD Reclaims Ground While USD/JPY Momentum Fades

EUR/USD Reclaims Ground While USD/JPY Momentum Fades

EUR/USD is recovering losses from 1.1500. USD/JPY is correcting gains from 159.00 and might decline further if it stays below 158.30. Important Takeaways for EUR/USD and USD/JPY Analysis Today The Euro struggled to stay in a positive zone and declined below 1.1700 before finding support. There was a break above a connecting bearish trend line

USD/CAD Daily Outlook - ActionForex

USD/CAD Daily Outlook – ActionForex

Daily Pivots: (S1) 1.3547; (P) 1.3575; (R1) 1.3609; More… Intraday bias in USD/CAD is turned neutral first with a temporary low formed at 1.3524. Nevertheless, outlook is unchanged that consolidation pattern from 1.3480 could have completed at 1.3751, after hitting 55 D EMA (now at 1.3704). Risk will stay on the downside as long as

AUD/USD Daily Report - ActionForex

AUD/USD Daily Report – ActionForex

Daily Pivots: (S1) 0.7058; (P) 0.7115; (R1) 0.7177; More… AUD/USD’s rally resumed by breaking through 0.7146 resistance today. Intraday bias is back on the upside for 100% projection of 0.5913 to 0.6706 from 0.6420 at 0.7213. Decisive break there could prompt upside acceleration to 161.8% projection at 0.7703. For now, outlook will remain bullish as

KCM Trade Awarded "Best Forex Trading Platform 2026" by FX Daily Info

KCM Trade Awarded “Best Forex Trading Platform 2026” by FX Daily Info

HONG KONG SAR – Media OutReach Newswire – 11 March 2026 – KCM Trade, a leading global CFD broker, has been honored with the “Best Forex Trading Platform 2026” award at the 2026 Industry Awards hosted by international financial media outlet FX Daily Info in March 2026, underscoring the Group’s brand strength and industry influence

AUD/USD breakout as RBA faces urgency to hike, 0.80 after clearing 0.72?

AUD/USD breakout as RBA faces urgency to hike, 0.80 after clearing 0.72?

Aussie has staged a remarkable breakout today, surging broadly higher to clip a near four-year peak against Dollar. AUD/USD is now knocking on the door of a critical resistance zone at 0.72. Firm break above this level wouldn’t just be a win for the bulls—it would signal strong underlying momentum that could pave the way

WTI Oil Eases Further on Encouraging Signals

WTI Oil Eases Further on Encouraging Signals

WTI oil extends pullback from Monday’s 3 ½ year high ($119.44) on Tuesday, following unexpected and sharp change in the sentiment after President Trump said that war in the Middle East could end soon. He also signaled that the US may lift some sanctions on sales of Russian oil, to partially compensate negative impact from

Gold Price Holds Near Key Support

Gold Price Holds Near Key Support

As the XAU/USD chart shows, the gold price has been holding within the $5,060–$5,200 range over the past several sessions. Bullish view: the key support is the lower boundary of the long-term channel that has been in place since the beginning of 2026. Bearish view: pressure on the price comes from statements by President Trump

EUR/USD Chart Analysis: Pair Rebounds from the Year’s Low

EUR/USD Chart Analysis: Pair Rebounds from the Year’s Low

Analysing the EUR/USD chart five days ago, we: → constructed a downward channel, noting signs that the bears remained in control; → outlined a scenario in which the rate would decline to a new yearly low (and test the lower boundary of the channel). Yesterday’s price action confirmed these assumptions – the low at H

Youtube preview

Forex range trading Gold, gap trading US indices [Video]

Today, we will take a look at Forex Trading on the Dow Jones Industrial Average, EURUSD, AUDUSD and Gold, XAUUSD. Last time we looked at buying the dip on gold, and we did, in fact, get a result. What we have now, however, is a range trading opportunity with price action almost perfectly placed between

Gold at Make-or-Break Support, Bounce Setup Forming?

Gold at Make-or-Break Support, Bounce Setup Forming?

Key Highlights Gold started a fresh decline from $5,420 and traded below $5,200. A major bullish trend line is forming with support at $5,040 on the 4-hour chart. WTI Crude Oil surged toward $120 before there was a sharp correction. USD/JPY extended gains and traded above 158.50. Gold Price Technical Analysis Gold remained well bid

London Session Time In India

London Session Time In India: The Best Forex Trading Session

The London session matters because it is the part of the forex day when liquidity usually rises, spreads often tighten, and major pairs such as EUR/USD and GBP/USD tend to move with more consistency. London also remains the world’s largest foreign exchange center.  In the latest BIS triennial survey, the UK accounted for 38.1% of

0
Would love your thoughts, please comment.x
()
x