USD/JPY Price Analysis: Firm on Fed Rate Support Despite Equity Wobble

  • The USD/JPY price analysis remains choppy despite a risk-off move in equities.
  • Reduced odds of early Fed rate cuts amid upbeat US data keep the greenback supported.
  • Japan’s political concerns weigh on the yen, but FX intervention warnings limit the downside.

The USD/JPY price is holding in a tight 158.40–158.60 range, shrugging off a modest risk-off move in US equities. Tech led the pullback, with the Nasdaq 100 down about 1.0%, while the S&P 500 and Dow slipped less. Despite softer risk sentiment, the dollar side of the pair remains well-supported, with the Dollar Index near 99.3, close to monthly highs.

Are you interested in learning more about forex tools? Check our detailed guide-

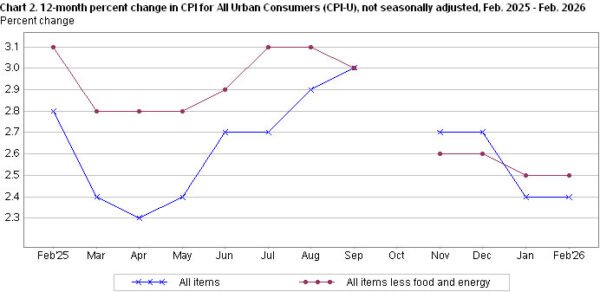
The macro backdrop in the US still points to a firm dollar and an uptrend in USD/JPY. November retail sales rebounded about 0.6% MoM after a small October decline, and producer prices went near 3.0% YoY on both headline and core measures.

The unemployment rate around 4.4% does not point to a sharp labor-market downturn. This combination of strong demand, rising upstream prices, and stable jobs has pushed back expectations of the first Fed cut to June.

In the near term, rates are expected to stay in the 3.50–3.75% range. There is no longer a strong expectation of aggressive early easing in markets, which supports yields and keeps USD/JPY dips toward 155.00 well bid.

On the Japanese side, politics and FX intervention are more important to the story than domestic yields. Officials have been warning more and more against “one-way excessive moves.” Chief Cabinet Secretary Seiji Kihara has even said that intervention could occur if the yen weakens too quickly.

That has helped JPY outperform some high-beta currencies on days when risk is low. But the “Takaichi trade” goes the other way; hopes for an early snap election, a win for Sanae Takaichi, and a budget with excessive spending support Japanese stocks more than the currency, leaving no clear way for the BoJ.

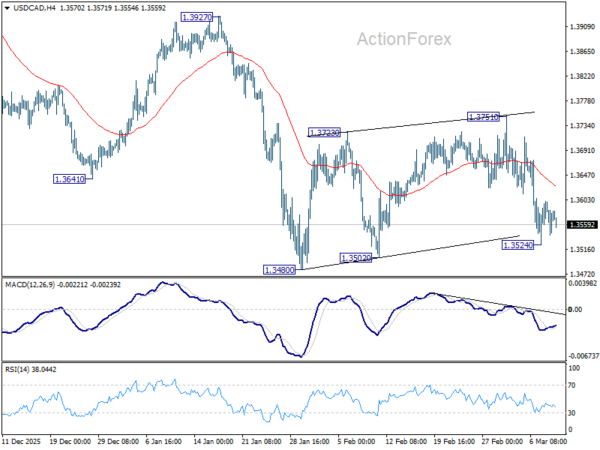
USD/JPY Technical Price Analysis: Consolidation Below 20-MA

USD/JPY Technical Price AnalysisUSD/JPY Technical Price Analysis
USD/JPY 4-hour chart

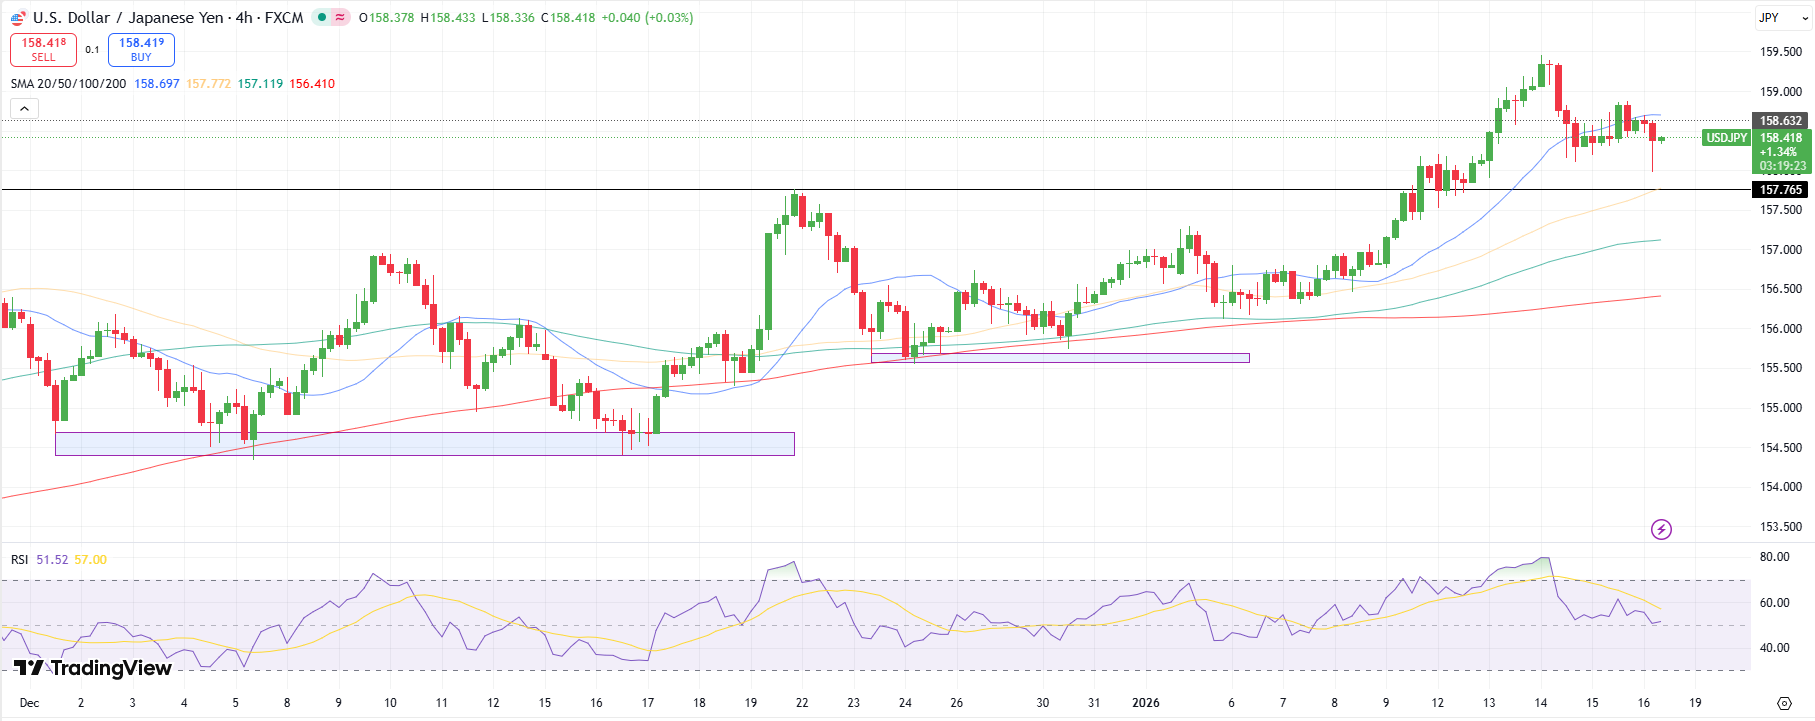
The 4-hour chart for USD/JPY shows selling pressure, as the price is below the 20-period MA. However, the pair has formed a bullish doji candlestick pattern, revealing sustained buying on the dips. Meanwhile, the pair continues to consolidate after falling from the 159.45 peak.

Are you interested in learning more about the best crypto exchange? Check our detailed guide- 

The RSI remains flat near 50.0, suggesting no clear momentum, while the MAs still point to more gains. The pair is expected to oscillate between 157.50 and 159.50. A clear breakout in either direction could trigger a meaningful trending move.

Looking to trade forex now? Invest at eToro!

68% of retail investor accounts lose money when trading CFDs with this provider. You should consider whether you can afford to take the high risk of losing your money.

Source link

Visited 1 times, 1 visit(s) today

Related Article

Elliott Wave Perspective: Assessing Oil’s (CL) Upside Amid War-Driven Volatility

Elliott Wave Perspective: Assessing Oil’s (CL) Upside Amid War-Driven Volatility

The short-term Elliott Wave outlook in Crude Oil (CL) indicates that the cycle from the December 16, 2025 low has advanced as a five-wave impulse. From that low, wave (1) concluded at $66.48, followed by a corrective pullback in wave (2) which ended at $61.12. The commodity then resumed its upward trajectory in wave (3),

Market maker Virtu expands OTC crypto pricing via new Talos partnership

Market maker Virtu expands OTC crypto pricing via new Talos partnership

Leading principal market maker Virtu Financial Inc (NYSE:VIRT) has announced that it has integrated with Talos, a provider of institutional digital asset infrastructure, technology and data supporting the full investment lifecycle. With this integration, Virtu is now streaming spot digital asset liquidity to institutional clients through the Talos platform. With more than 17 years of

Image for representation

Rupee falls 4 paise to 91.89 against U.S. dollar in early trade

Image for representation | Photo Credit: Getty Images The rupee fell 4 paise to 91.89 against U.S. dollar in early trade on Wednesday (March 11, 2026) weighed down by FII outflows and the unrelenting conflict in the Middle East. However, a weaker greenback and falling global crude oil prices prevented sharper loss in the local

S&P 500 Fluctuates Ahead of CPI Report

S&P 500 Fluctuates Ahead of CPI Report

As the S&P 500 chart (US SPX 500 mini on FXOpen) shows, the index is trading near the 6,800 level this morning. However, the balance between supply and demand could change significantly after the release of the Consumer Price Index (CPI) report scheduled for 15:30 GMT+3. Against the backdrop of military developments in the Middle

US CPI steady at 2.4% in February, core unchanged at 2.5

US CPI steady at 2.4% in February, core unchanged at 2.5

US inflation rose slightly faster than expected in February, though the broader price trend remained stable. Headline CPI increased 0.3% mom, above the expected 0.2% rise, while core CPI—which excludes food and energy—rose 0.2% on the month, matching market expectations. Housing costs continued to play the largest role in the monthly increase. The shelter index

EUR/USD Reclaims Ground While USD/JPY Momentum Fades

EUR/USD Reclaims Ground While USD/JPY Momentum Fades

EUR/USD is recovering losses from 1.1500. USD/JPY is correcting gains from 159.00 and might decline further if it stays below 158.30. Important Takeaways for EUR/USD and USD/JPY Analysis Today The Euro struggled to stay in a positive zone and declined below 1.1700 before finding support. There was a break above a connecting bearish trend line

USD/CAD Daily Outlook - ActionForex

USD/CAD Daily Outlook – ActionForex

Daily Pivots: (S1) 1.3547; (P) 1.3575; (R1) 1.3609; More… Intraday bias in USD/CAD is turned neutral first with a temporary low formed at 1.3524. Nevertheless, outlook is unchanged that consolidation pattern from 1.3480 could have completed at 1.3751, after hitting 55 D EMA (now at 1.3704). Risk will stay on the downside as long as

AUD/USD Daily Report - ActionForex

AUD/USD Daily Report – ActionForex

Daily Pivots: (S1) 0.7058; (P) 0.7115; (R1) 0.7177; More… AUD/USD’s rally resumed by breaking through 0.7146 resistance today. Intraday bias is back on the upside for 100% projection of 0.5913 to 0.6706 from 0.6420 at 0.7213. Decisive break there could prompt upside acceleration to 161.8% projection at 0.7703. For now, outlook will remain bullish as

KCM Trade Awarded "Best Forex Trading Platform 2026" by FX Daily Info

KCM Trade Awarded “Best Forex Trading Platform 2026” by FX Daily Info

HONG KONG SAR – Media OutReach Newswire – 11 March 2026 – KCM Trade, a leading global CFD broker, has been honored with the “Best Forex Trading Platform 2026” award at the 2026 Industry Awards hosted by international financial media outlet FX Daily Info in March 2026, underscoring the Group’s brand strength and industry influence

AUD/USD breakout as RBA faces urgency to hike, 0.80 after clearing 0.72?

AUD/USD breakout as RBA faces urgency to hike, 0.80 after clearing 0.72?

Aussie has staged a remarkable breakout today, surging broadly higher to clip a near four-year peak against Dollar. AUD/USD is now knocking on the door of a critical resistance zone at 0.72. Firm break above this level wouldn’t just be a win for the bulls—it would signal strong underlying momentum that could pave the way

WTI Oil Eases Further on Encouraging Signals

WTI Oil Eases Further on Encouraging Signals

WTI oil extends pullback from Monday’s 3 ½ year high ($119.44) on Tuesday, following unexpected and sharp change in the sentiment after President Trump said that war in the Middle East could end soon. He also signaled that the US may lift some sanctions on sales of Russian oil, to partially compensate negative impact from

Gold Price Holds Near Key Support

Gold Price Holds Near Key Support

As the XAU/USD chart shows, the gold price has been holding within the $5,060–$5,200 range over the past several sessions. Bullish view: the key support is the lower boundary of the long-term channel that has been in place since the beginning of 2026. Bearish view: pressure on the price comes from statements by President Trump

EUR/USD Chart Analysis: Pair Rebounds from the Year’s Low

EUR/USD Chart Analysis: Pair Rebounds from the Year’s Low

Analysing the EUR/USD chart five days ago, we: → constructed a downward channel, noting signs that the bears remained in control; → outlined a scenario in which the rate would decline to a new yearly low (and test the lower boundary of the channel). Yesterday’s price action confirmed these assumptions – the low at H

Youtube preview

Forex range trading Gold, gap trading US indices [Video]

Today, we will take a look at Forex Trading on the Dow Jones Industrial Average, EURUSD, AUDUSD and Gold, XAUUSD. Last time we looked at buying the dip on gold, and we did, in fact, get a result. What we have now, however, is a range trading opportunity with price action almost perfectly placed between

Gold at Make-or-Break Support, Bounce Setup Forming?

Gold at Make-or-Break Support, Bounce Setup Forming?

Key Highlights Gold started a fresh decline from $5,420 and traded below $5,200. A major bullish trend line is forming with support at $5,040 on the 4-hour chart. WTI Crude Oil surged toward $120 before there was a sharp correction. USD/JPY extended gains and traded above 158.50. Gold Price Technical Analysis Gold remained well bid

London Session Time In India

London Session Time In India: The Best Forex Trading Session

The London session matters because it is the part of the forex day when liquidity usually rises, spreads often tighten, and major pairs such as EUR/USD and GBP/USD tend to move with more consistency. London also remains the world’s largest foreign exchange center.  In the latest BIS triennial survey, the UK accounted for 38.1% of

0
Would love your thoughts, please comment.x
()
x