FACT: Foreign exchange trading in rubles is down by 96%.
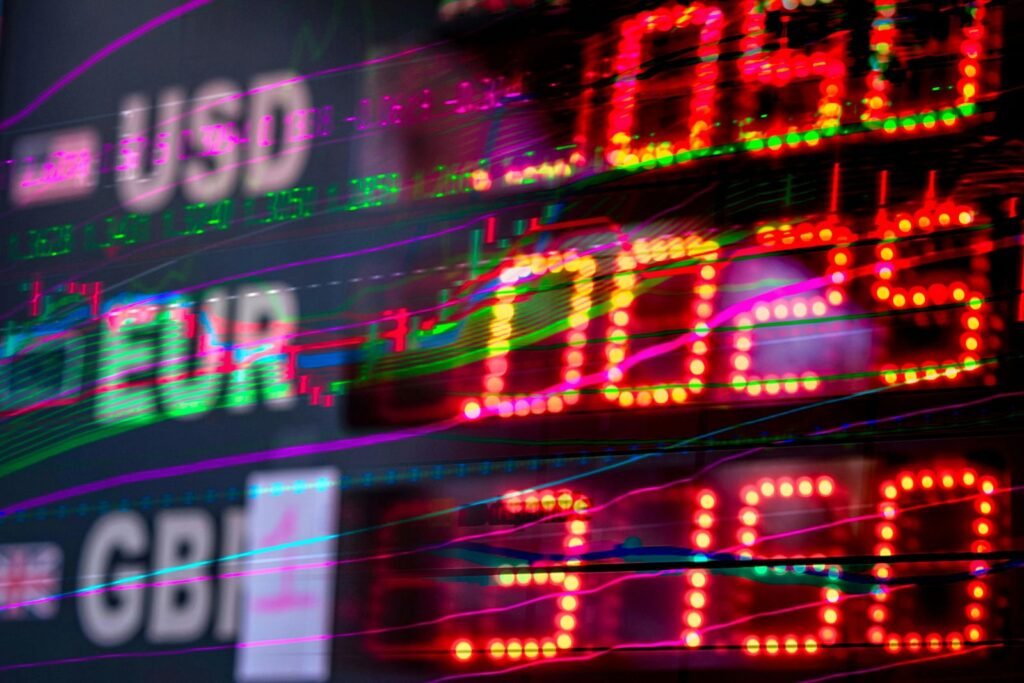
THE NUMBERS: Daily currency exchange* —
| 2019 | 2025 | Change | |
| All currencies | $6.58 trillion | $9.60 trillion | +45% |
| Dollar | $5.81 trillion | $8.56 trillion | +47% |
| Euro | $2.13 trillion | $2.77 trillion | +30% |
| Yen | $1.11 trillion | $1.61 trillion | +45% |
| Renminbi | $0.29 trillion | $0.82 trillion | +187% |
| Pound | $0.84 trillion | $0.98 trillion | +16% |
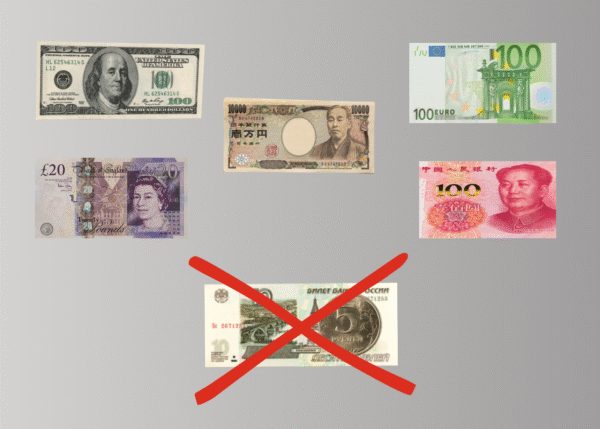
| Ruble | $0.07 trillion | $0.003 trillion | -96% |
* Bank of International Settlements 2025 Triennial Central Bank Survey of Foreign Exchange
WHAT THEY MEAN:
Every three years, the Bank of International Settlements in Basel guesses at how much money currency traders – government ministries and central banks, firms buying and selling across borders, tourists, computerized hedge-fund trading programs — exchange in a day. Their 2025 “Triennial Central Bank Survey of Foreign Exchange,” out in September, reports $9.6 trillion (combining sellers’ earnings with buyers’ payments). Over a full year that comes to almost exactly $3.5 quadrillion. A few particulars:
Dollar role little changed: U.S. dollars figured in 89.2% of the world’s currency exchanges this spring. This figure has been stable throughout the 21st century, as earlier Triennial Surveys found dollars used in 88.6% of all currency transactions in 2022, a slightly lower 84.9% in financial crisis-plagued 2010, and 89.9% in 2001. Looking at other currencies, the Survey gives some substance to financial-press speculation about the Chinese renminbi’s rising role: renminbi showed up in 2% of currency exchanges in 2013, 4% in 2019, and 7% in 2025. The euro, yen, and pound shares have meanwhile dipped a bit, with euros down from 39% of transactions in 2013 to 31% in 2025, yen from 23% to 17%, and sterling from 13% to 10%.
U.K. the forex center: City of London banks and firms handle 38% of all world currency trades, or about $1 quadrillion worth each year. As context for a twelve-zero number like this — $1,000,000,000,000,000 — “world GDP” is about $120 trillion, so London’s quadrillion in forex turnover is about 10 times the size of the ‘real’ goods and services world economy. New York ranks second with 19%, while Asia’s three big currency trading centers — Singapore, Hong Kong, and Tokyo — have 12%, 7%, and 4% respectively, or 23% combined. Most exchange of major currencies basically track this division of labor, but renminbi trading is a little unusual; it isn’t concentrated in any one place, but instead is roughly evenly divided between London, Hong Kong, Shanghai, Singapore, and New York.
Collapse of ruble trading: The survey’s calculations, which show 39 individual currencies as well as worldwide totals, typically show trading levels in any particular currency rising over time, though at different rates. One bright-red exception: under the weight of international sanctions — for example, U.S., UK, EU, and Japanese prohibitions on transactions with the Russian central bank, purchasing of ruble-denominated bonds, and lending to Russian financial institutions — along with Russia’s own currency restrictions, trading in Russian rubles has plunged by 96% since the full-scale invasion of Ukraine in early 2022.
The actual numbers here: the $72 billion in daily ruble trading in 2019 fell to $13 billion in 2022, and to $3 billion in 2025. As a point of comparison, this $3 billion is just above the $1 billion in daily trading in Argentine pesos and a notch below the $4 billion in Bulgarian lev exchange. By market, ruble trading is down 95% in Singapore, 96.5% in London, 99% in New York, 99.4% in Hong Kong, and 99.9% in Zurich. Those wishing to dispose of rubles do, though, have one notable refuge: ruble trading has grown about 100-fold in the United Arab Emirates — $18 million in 2019, $2.7 billion in 2025 — which now does almost two-thirds of all world ruble trading.
FURTHER READING
BIS’ 2025 Triennial Survey of the $3.5 quadrillion annual, $9.6 trillion daily, world foreign exchange market.
Regulators and sanctions:
The U.K.’s Financial Conduct Authority regulates the City of London, the world’s largest currency-exchange center.
Japan’s Finance Ministry imposes new Russia sanctions.
A sanctions brief from the European Council.
And the U.S. Treasury Department monitors dollar exchange rates and explains sanctions on ruble-trading.
And some comparisons:
Then and now: A generation ago, in the last days of the managed-exchange-rate “Bretton Woods System,” currency turnover was a comparatively modest $6 trillion a year, mostly facilitating tourism, debt repayments, and import/export trade. The “floating exchange,” which replaced Bretton Woods, launched in March 1973, has since become the largest market of any sort in human history. The BiS estimates, converted from their “daily turnover” headlines to the annual totals:
| 2025 | $3.502 quadrillion |
| 2022 | $2.726 quadrillion |
| 2019 | $2.402 quadrillion |
| 2016 | $1.849 quadrillion |
| 2010 | $1.450 quadrillion |
| 2001 | $0.452 quadrillion |
| 1992 | $0.298 quadrillion |
| 1970 | $0.006 quadrillion |
“All the money in the world”: Dividing BiS’s double-entry forex totals in half to make them comparable to trade flows, wealth held in banks and securities, etc., currency trading matches up against world GDP, privately held wealth, circulating money, and goods-services trade like this:
| Currency exchange, 2025 | $1,750 trillion |
| Total privately held wealth, 2024 | ~$475 trillion |
| World GDP, 2025 | $117 trillion |
| All physical money in banks, bills, & coins | $50 trillion |
| All goods/service trade, 2024 | $33 trillion |
| All circulating bills and coins | ~$8 trillion |
The WTO’s trade statistics dashboard shows trade in goods at $24.4 trillion last year, and trade in services $8.6 trillion.
The IMF’s World Economic Outlook database has the total global GDP at $117 trillion this year, with the U.S. contributing $30.6 trillion, China $19.4 trillion, the EU $21.2 trillion, Japan $4.3 trillion, the U.K. $4.0 trillion, and all other countries $36 trillion.
UBS’s 2025 Global Wealth Report reviews economic data from 56 countries and territories,* which they believe hold about 92% of all privately held world wealth. (I.e., the value of homes and properties, stocks and bonds, bank deposits, etc., excluding government assets.) They place this total at about $475 trillion, so adding the other 8% would yield a world wealth total of about $515 trillion.
ABOUT ED
Ed Gresser is Vice President and Director for Trade and Global Markets at PPI.
Ed returns to PPI after working for the think tank from 2001-2011. He most recently served as the Assistant U.S. Trade Representative for Trade Policy and Economics at the Office of the United States Trade Representative (USTR). In this position, he led USTR’s economic research unit from 2015-2021, and chaired the 21-agency Trade Policy Staff Committee.
Ed began his career on Capitol Hill before serving USTR as Policy Advisor to USTR Charlene Barshefsky from 1998 to 2001. He then led PPI’s Trade and Global Markets Project from 2001 to 2011. After PPI, he co-founded and directed the independent think tank ProgressiveEconomy until rejoining USTR in 2015. In 2013, the Washington International Trade Association presented him with its Lighthouse Award, awarded annually to an individual or group for significant contributions to trade policy.
Ed is the author of Freedom from Want: American Liberalism and the Global Economy (2007). He has published in a variety of journals and newspapers, and his research has been cited by leading academics and international organizations including the WTO, World Bank, and International Monetary Fund. He is a graduate of Stanford University and holds a Master’s Degree in International Affairs from Columbia Universities and a certificate from the Averell Harriman Institute for Advanced Study of the Soviet Union.