Key Highlights
- USD/JPY extended losses and tested the 146.60 zone.
- A major bearish trend line is forming with resistance at 148.80 on the 4-hour chart.
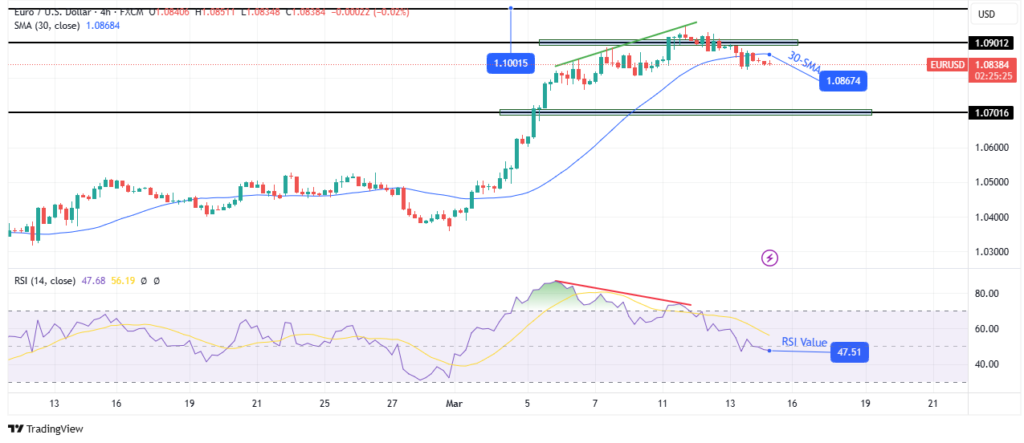
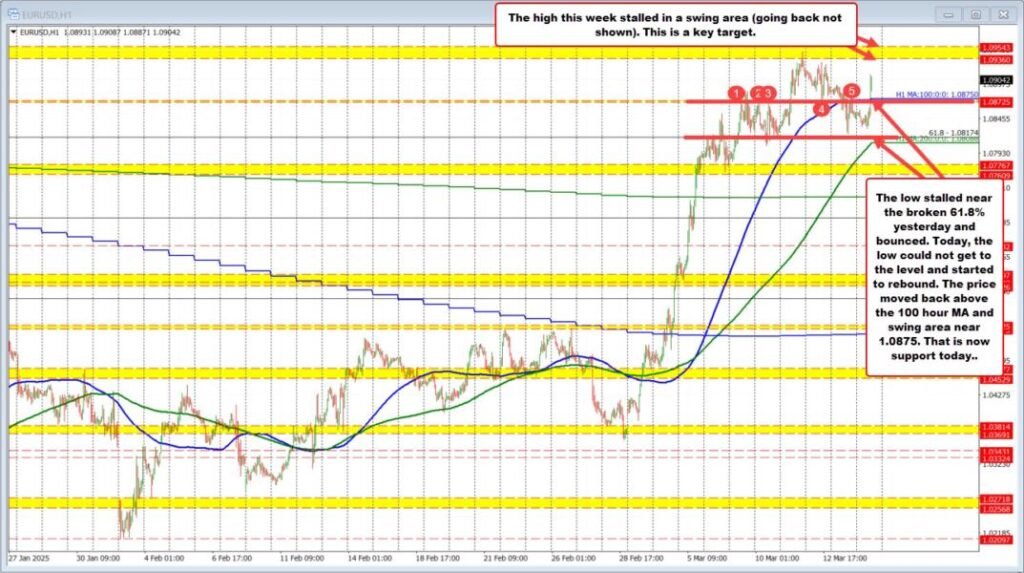
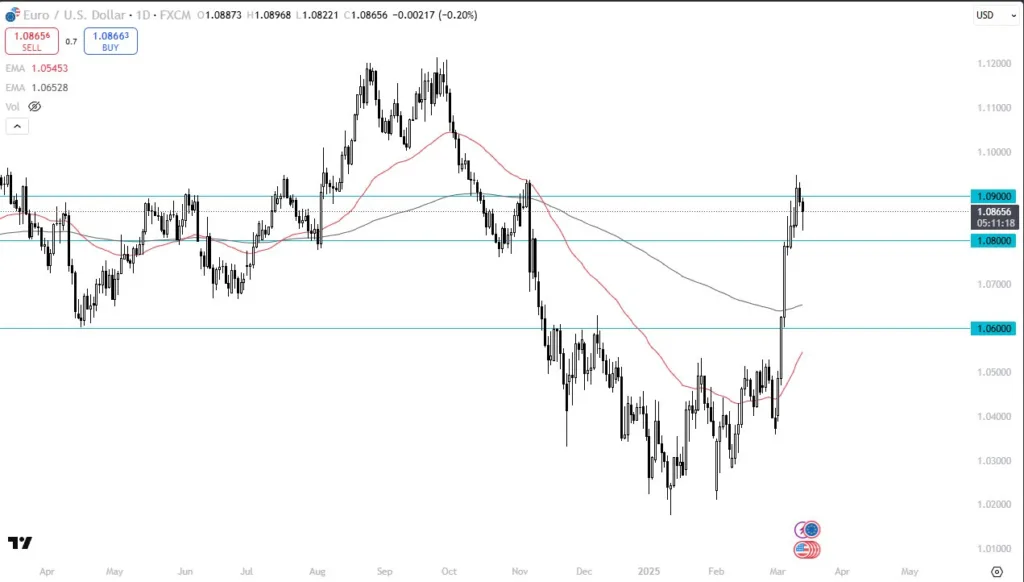
- EUR/USD is consolidating gains above the 1.0800 resistance zone.
- Bitcoin is facing many hurdles near the $85,000 resistance zone.
USD/JPY Technical Analysis
The US Dollar remained in a bearish zone below 148.80 against the Japanese Yen. USD/JPY extended losses below 147.50 before the bulls appeared.
Looking at the 4-hour chart, the pair tested the 146.60 zone and settled below the 100 simple moving average (red, 4-hour) and the 200 simple moving average (green, 4-hour). The pair started a minor recovery wave above the 147.50 level.
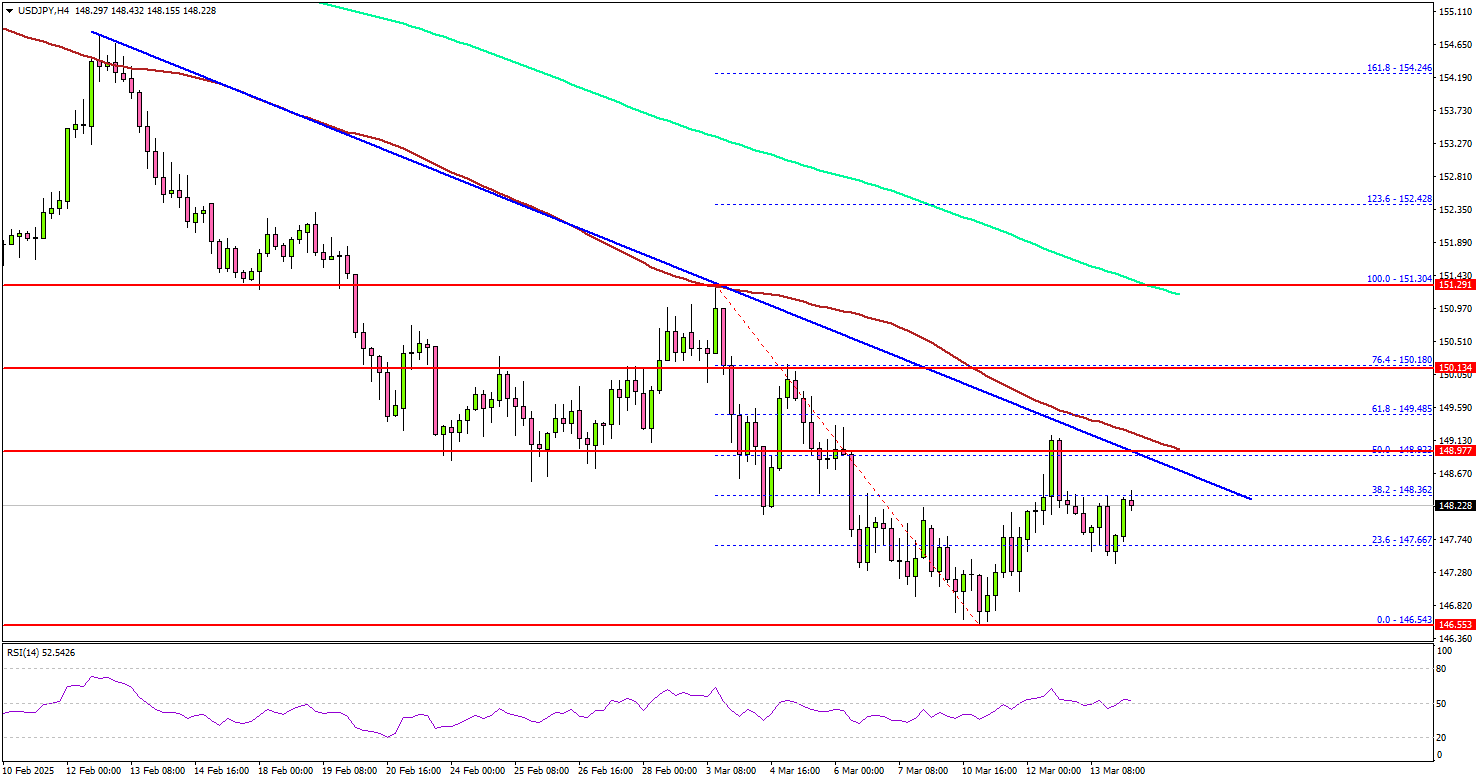
There was a spike above 148.50 but the bears were active near the 50% Fib retracement level of the downward move from the 151.30 swing high to the 146.63 low.
On the upside, the pair is facing resistance near the 148.80 level. There is also a major bearish trend line forming with resistance at 148.80 on the same chart. The next major resistance is near the 149.50 level and the 61.8% Fib retracement level of the downward move from the 151.30 swing high to the 146.63 low.
The main resistance is now forming near the 150.20 zone. A close above the 150.20 level could set the tone for another increase. In the stated case, the pair could even clear the 152.00 resistance.
On the downside, immediate support sits near the 147.50 level. The next key support sits near the 147.20 level. Any more losses could send the pair toward the 146.60 level. The main support could be 145.00.
Looking at EUR/USD, the pair remained stable and might soon now aim for a move toward the 1.1000 resistance.
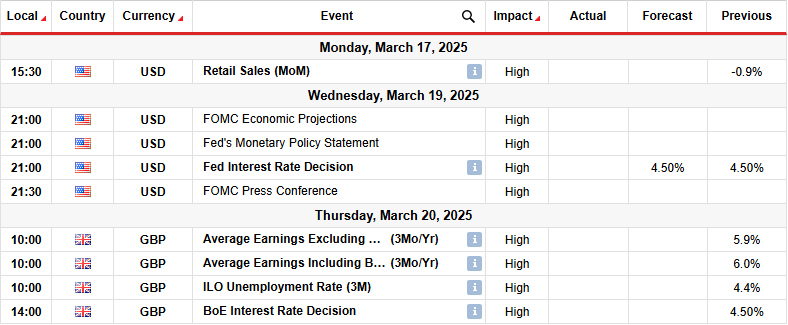
Upcoming Economic Events:
- Michigan Consumer Sentiment Index for Mar 2025 (Prelim) – Forecast 63.4, versus 64.7 previous.