GBP/USD Signal Today – 16/10: Sterling at Risk (Chart)

Bearish View

  • Sell the GBP/USD pair and set a take-profit at 1.2890.
  • Add a stop-loss at 1.3150.
  • Timeline: 1-2 days.

Bullish View

  • Set a buy-stop at 1.3140 and a take-profit at 1.3250.
  • Add a stop-loss at 1.3050.

GBP/USD Signal Today - 16/10: Sterling at Risk (Chart)

The GBP/USD exchange rate remained on edge ahead of the upcoming UK consumer inflation report. It was trading at 1.3063 on Wednesday morning, down by over 2.73% from its highest level this month.

UK Inflation Report

The GBP/USD pair moved sideways after the Office of National Statistics (ONS) released the latest UK jobs numbers.

These numbers revealed that the unemployment rate improved to 4.0% in August, lower than the median estimate of 4.1%.

Also, the average earnings index with bonuses rose to 3.8% in August from 4.1% in the previous month.

The next key GBP/USD news will be the UK inflation data, which will provide more information on whether the actions by the Bank of England (BoE) are working.

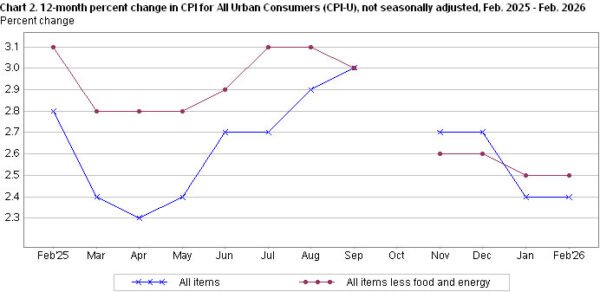
Analysts expect the report to show that the headline CPI dropped from 0.3% to 0.2% on a MoM basis. They also see the core CPI, which excludes the volatile food and energy products, to drop from 0.4% to 0.3%.

The two numbers are expected to drop to 1.9% and 3.4%, respectively. If these estimates are correct, they will raise the probability that the Bank of England (BoE) will restart cutting interest rates in the next meeting since it has achieved its inflation target.

The GBP/USD pair also reacted to the rising hopes that the Labor administration will start hiking taxes as Chancellor Rachel Reeves works to fill a £40 billion gap. She will share her plans when she delivers her budget proposals on October 30th.

Analysts caution that hiking taxes would make the UK less competitive, especially after the Brexit vote.

There will be no major US economic data on Wednesday. As such, traders will continue focusing on Thursday’s retail sales and jobless claims numbers.

GBP/USD Technical Analysis

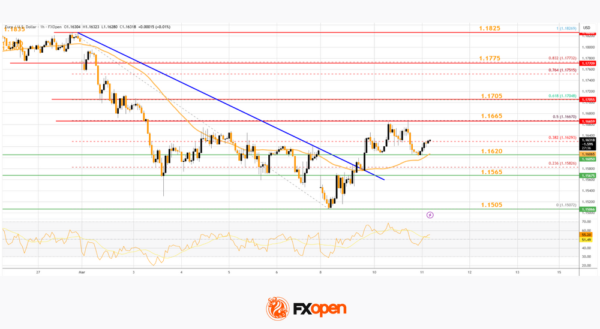
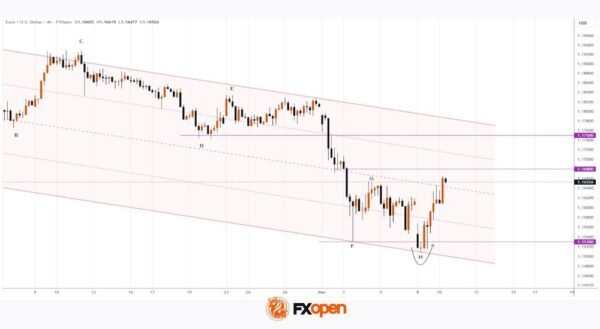
The GBP/USD exchange pair has been in a strong downward trend in the past two weeks as the US dollar index staged a strong comeback.

It has slipped below the important support level at 1.3142, its highest level on July 14. The pair has also moved below the 50-day Exponential Moving Average (EMA), while the MACD and the Relative Strength Index (RSI) have pointed downwards.

It has formed a rising broadening wedge pattern, a popular reversal sign. Therefore, the GBP/USD pair will likely have a bearish breakout as sellers target the key support at 1.2895, the 38.2% Fibonacci Retracement point.

Ready to trade our free daily Forex trading signals? We’ve shortlisted the top UK forex brokers in the industry for you. 

Source link

Visited 1 times, 1 visit(s) today

Related Article

Market maker Virtu expands OTC crypto pricing via new Talos partnership

Market maker Virtu expands OTC crypto pricing via new Talos partnership

Leading principal market maker Virtu Financial Inc (NYSE:VIRT) has announced that it has integrated with Talos, a provider of institutional digital asset infrastructure, technology and data supporting the full investment lifecycle. With this integration, Virtu is now streaming spot digital asset liquidity to institutional clients through the Talos platform. With more than 17 years of

Image for representation

Rupee falls 4 paise to 91.89 against U.S. dollar in early trade

Image for representation | Photo Credit: Getty Images The rupee fell 4 paise to 91.89 against U.S. dollar in early trade on Wednesday (March 11, 2026) weighed down by FII outflows and the unrelenting conflict in the Middle East. However, a weaker greenback and falling global crude oil prices prevented sharper loss in the local

S&P 500 Fluctuates Ahead of CPI Report

S&P 500 Fluctuates Ahead of CPI Report

As the S&P 500 chart (US SPX 500 mini on FXOpen) shows, the index is trading near the 6,800 level this morning. However, the balance between supply and demand could change significantly after the release of the Consumer Price Index (CPI) report scheduled for 15:30 GMT+3. Against the backdrop of military developments in the Middle

US CPI steady at 2.4% in February, core unchanged at 2.5

US CPI steady at 2.4% in February, core unchanged at 2.5

US inflation rose slightly faster than expected in February, though the broader price trend remained stable. Headline CPI increased 0.3% mom, above the expected 0.2% rise, while core CPI—which excludes food and energy—rose 0.2% on the month, matching market expectations. Housing costs continued to play the largest role in the monthly increase. The shelter index

EUR/USD Reclaims Ground While USD/JPY Momentum Fades

EUR/USD Reclaims Ground While USD/JPY Momentum Fades

EUR/USD is recovering losses from 1.1500. USD/JPY is correcting gains from 159.00 and might decline further if it stays below 158.30. Important Takeaways for EUR/USD and USD/JPY Analysis Today The Euro struggled to stay in a positive zone and declined below 1.1700 before finding support. There was a break above a connecting bearish trend line

USD/CAD Daily Outlook - ActionForex

USD/CAD Daily Outlook – ActionForex

Daily Pivots: (S1) 1.3547; (P) 1.3575; (R1) 1.3609; More… Intraday bias in USD/CAD is turned neutral first with a temporary low formed at 1.3524. Nevertheless, outlook is unchanged that consolidation pattern from 1.3480 could have completed at 1.3751, after hitting 55 D EMA (now at 1.3704). Risk will stay on the downside as long as

AUD/USD Daily Report - ActionForex

AUD/USD Daily Report – ActionForex

Daily Pivots: (S1) 0.7058; (P) 0.7115; (R1) 0.7177; More… AUD/USD’s rally resumed by breaking through 0.7146 resistance today. Intraday bias is back on the upside for 100% projection of 0.5913 to 0.6706 from 0.6420 at 0.7213. Decisive break there could prompt upside acceleration to 161.8% projection at 0.7703. For now, outlook will remain bullish as

KCM Trade Awarded "Best Forex Trading Platform 2026" by FX Daily Info

KCM Trade Awarded “Best Forex Trading Platform 2026” by FX Daily Info

HONG KONG SAR – Media OutReach Newswire – 11 March 2026 – KCM Trade, a leading global CFD broker, has been honored with the “Best Forex Trading Platform 2026” award at the 2026 Industry Awards hosted by international financial media outlet FX Daily Info in March 2026, underscoring the Group’s brand strength and industry influence

AUD/USD breakout as RBA faces urgency to hike, 0.80 after clearing 0.72?

AUD/USD breakout as RBA faces urgency to hike, 0.80 after clearing 0.72?

Aussie has staged a remarkable breakout today, surging broadly higher to clip a near four-year peak against Dollar. AUD/USD is now knocking on the door of a critical resistance zone at 0.72. Firm break above this level wouldn’t just be a win for the bulls—it would signal strong underlying momentum that could pave the way

WTI Oil Eases Further on Encouraging Signals

WTI Oil Eases Further on Encouraging Signals

WTI oil extends pullback from Monday’s 3 ½ year high ($119.44) on Tuesday, following unexpected and sharp change in the sentiment after President Trump said that war in the Middle East could end soon. He also signaled that the US may lift some sanctions on sales of Russian oil, to partially compensate negative impact from

Gold Price Holds Near Key Support

Gold Price Holds Near Key Support

As the XAU/USD chart shows, the gold price has been holding within the $5,060–$5,200 range over the past several sessions. Bullish view: the key support is the lower boundary of the long-term channel that has been in place since the beginning of 2026. Bearish view: pressure on the price comes from statements by President Trump

EUR/USD Chart Analysis: Pair Rebounds from the Year’s Low

EUR/USD Chart Analysis: Pair Rebounds from the Year’s Low

Analysing the EUR/USD chart five days ago, we: → constructed a downward channel, noting signs that the bears remained in control; → outlined a scenario in which the rate would decline to a new yearly low (and test the lower boundary of the channel). Yesterday’s price action confirmed these assumptions – the low at H

Youtube preview

Forex range trading Gold, gap trading US indices [Video]

Today, we will take a look at Forex Trading on the Dow Jones Industrial Average, EURUSD, AUDUSD and Gold, XAUUSD. Last time we looked at buying the dip on gold, and we did, in fact, get a result. What we have now, however, is a range trading opportunity with price action almost perfectly placed between

Gold at Make-or-Break Support, Bounce Setup Forming?

Gold at Make-or-Break Support, Bounce Setup Forming?

Key Highlights Gold started a fresh decline from $5,420 and traded below $5,200. A major bullish trend line is forming with support at $5,040 on the 4-hour chart. WTI Crude Oil surged toward $120 before there was a sharp correction. USD/JPY extended gains and traded above 158.50. Gold Price Technical Analysis Gold remained well bid

London Session Time In India

London Session Time In India: The Best Forex Trading Session

The London session matters because it is the part of the forex day when liquidity usually rises, spreads often tighten, and major pairs such as EUR/USD and GBP/USD tend to move with more consistency. London also remains the world’s largest foreign exchange center.  In the latest BIS triennial survey, the UK accounted for 38.1% of

D 20260309 Image2

FX Daily Snapshot – MUFG Research

The price of oil has continued to surge higher at the start of this week driven by the ongoing conflict in the Middle East. The price of Brent has hit a fresh high overnight of USD119.50/barrel before dropping back below USD110/barrel. At the worst point it had extended its advance to almost two thirds since

AUD/USD and NZD/USD Struggle as Market Jitters Shake Risk Sentiment

AUD/USD and NZD/USD Struggle as Market Jitters Shake Risk Sentiment

AUD/USD failed to stay in a positive zone and declined below 0.7000. NZD/USD is also moving lower and might extend losses below 0.5850. Important Takeaways for AUD/USD and NZD/USD Analysis Today The Aussie Dollar started a fresh decline from well above 0.7100 against the US Dollar. There is a bearish trend line forming with resistance

0
Would love your thoughts, please comment.x
()
x