3 Asian Stocks Estimated To Be Trading At Up To 37.5% Below Intrinsic Value
As geopolitical tensions and energy price volatility continue to influence global markets, Asian equities have not been immune to these pressures. Despite these challenges, opportunities may exist for investors seeking undervalued stocks that are trading below their intrinsic value. In such a climate, identifying stocks with strong fundamentals and potential for growth can be key to navigating uncertain market conditions.
Here’s a peek at a few of the choices from the screener.
Overview: RemeGen Co., Ltd. is a biopharmaceutical company focused on the discovery, development, production, and commercialization of biological drugs for autoimmune, oncology, and ophthalmic diseases in Mainland China and the United States with a market cap of approximately HK$72.41 billion.
Operations: RemeGen’s revenue primarily comes from its biopharmaceutical research, service, production, and sales segment, generating approximately CN¥3.25 billion.
Estimated Discount To Fair Value: 24.4%
RemeGen’s stock is trading at HK$98.85, significantly below its estimated future cash flow value of HK$130.7, making it highly undervalued based on discounted cash flow analysis. The company’s earnings are forecast to grow at 24.91% annually, surpassing the Hong Kong market average of 12.4%. Recent approval of Disitamab Vedotin for a new indication and strategic licensing agreements further bolster its growth prospects despite recent insider selling concerns and high non-cash earnings levels.
SEHK:9995 Discounted Cash Flow as at Mar 2026
Overview: Eastroc Beverage (Group) Co., Ltd. manufactures and distributes beverages in China, Vietnam, and Malaysia, with a market cap of CN¥127.06 billion.
Operations: The company generates revenue of CN¥20.12 billion from the production, sales, and wholesale of beverages and pre-packaged foods across its operating regions.
Estimated Discount To Fair Value: 37.5%
Eastroc Beverage (Group) is trading at CN¥227.99, well below its estimated future cash flow value of CN¥364.81, highlighting its undervaluation based on discounted cash flow analysis. Earnings are projected to grow significantly at 21.83% annually over the next three years, although slightly slower than the overall Chinese market’s growth rate of 27.1%. Recent equity offerings totaling HKD 10.14 billion may enhance capital structure but could affect dividend stability due to an unstable track record.
SHSE:605499 Discounted Cash Flow as at Mar 2026
Overview: Accelink Technologies Co., Ltd. is engaged in the research, development, manufacturing, sales, and provision of technical services for optoelectronic chips, devices, modules, and subsystem products primarily in China with a market cap of CN¥71.07 billion.
Operations: The company’s revenue primarily comes from its Communication Equipment Manufacturing segment, which generated CN¥11.38 billion.
Estimated Discount To Fair Value: 28.1%
Accelink Technologies CoLtd is trading at CN¥88.1, significantly below its estimated future cash flow value of CN¥122.47, indicating undervaluation. The company’s earnings are forecast to grow robustly at 32% annually over the next three years, outpacing the Chinese market’s growth rate of 27.1%. Despite a volatile share price recently and a projected low return on equity (14.7%), its revenue is expected to increase by 20.5% per year, exceeding market expectations.
SZSE:002281 Discounted Cash Flow as at Mar 2026
This article by Simply Wall St is general in nature. We provide commentary based on historical data and analyst forecasts only using an unbiased methodology and our articles are not intended to be financial advice. It does not constitute a recommendation to buy or sell any stock, and does not take account of your objectives, or your financial situation. We aim to bring you long-term focused analysis driven by fundamental data. Note that our analysis may not factor in the latest price-sensitive company announcements or qualitative material. Simply Wall St has no position in any stocks mentioned.
Companies discussed in this article include SEHK:9995 SHSE:605499 and SZSE:002281.
This article was originally published by Simply Wall St.
Press Release Weekly progress on share repurchase program to cover share plans and reduce capital Kaiseraugst (Switzerland), Maastricht (Netherlands), March 31, 2026 dsm-firmenich, innovators in nutrition, health, and beauty, announced on February 9, 2026 its intention to repurchase ordinary shares with an aggregate market value of €500 million and reduce its issued capital. On March
The Buckle, Inc. (NYSE:BKE) is included among the Dividend Capture Strategy: 14 High Yield Stocks to Buy in April. UBS Keeps Neutral Rating on Buckle (BKE) as Growth Remains Steady but Unchanged On March 16, UBS analyst Mauricio Serna trimmed his price recommendation on The Buckle, Inc. (NYSE:BKE) to $53 from $55. It reiterated a
Goldman Sachs warned that the market has misinterpreted this crisis as a “hawkish policy shock,” with interest rate hikes priced beyond fundamental levels, creating highly asymmetric downside risks. History shows that after oil supply shocks, policy rates tend to rise slightly within 1 to 3 months but fall back within 6 to 9 months as
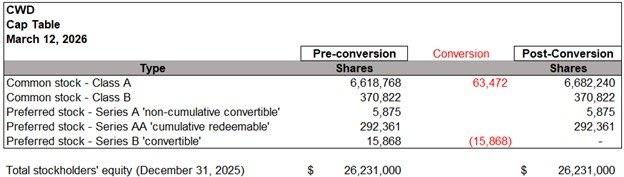
SCOTTSDALE, Ariz., March 30, 2026 (GLOBE NEWSWIRE) — Caliber (Nasdaq CWD), a diversified real estate and digital asset management platform, today announced that an institutional investor elected to convert approximately $15.9 million of perpetual convertible preferred equity into shares of the Company’s common stock. Under the original investment, Caliber issued 15,868 shares of Series B
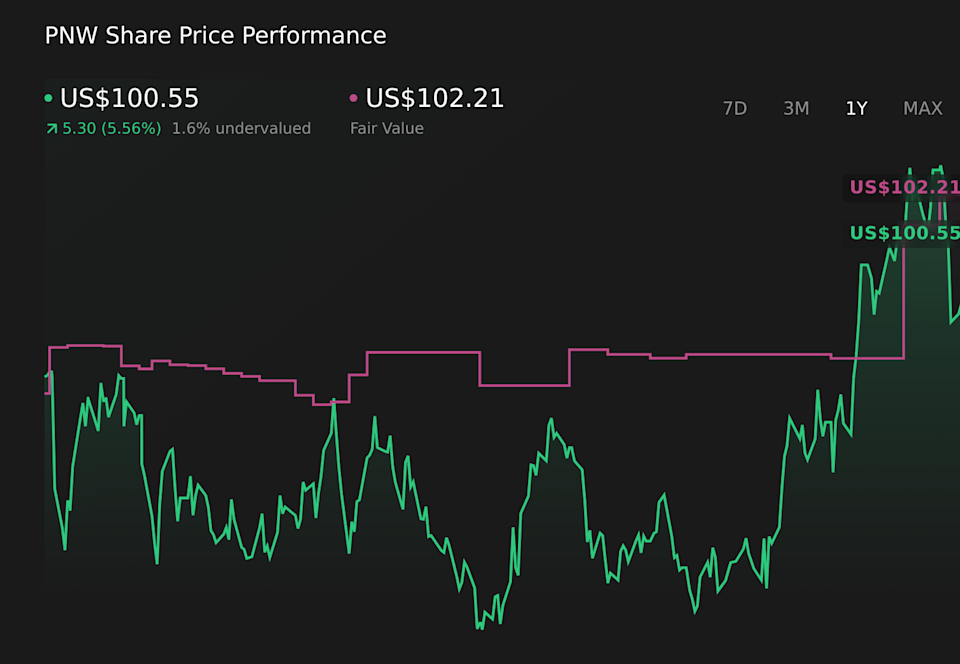
Track your investments for FREE with Simply Wall St, the portfolio command center trusted by over 7 million individual investors worldwide. The modelled fair value for Pinnacle West Capital has inched from US$102.00 to US$102.21 per share, a small move that still attracts attention when analysts are tightening their assumptions. Recent research updates describe a
Find your next quality investment with Simply Wall St’s easy and powerful screener, trusted by over 7 million individual investors worldwide. Realty Income (O) continues to attract attention as a large, diversified net lease REIT, with a market value of about US$56.8b and a reported portfolio exceeding 15,500 properties across the U.S., U.K., and Europe.
Investors often wish they could go back and buy a top growth stock at the price it was at many years ago. With Nike (NYSE: NKE) stock, you have that opportunity today. It’s trading at the levels it was at in 2017. The only problem is that the economy is much different today than it
Today’s Change (-9.06%) $-6.27 Current Price $62.90 Key Data Points Market Cap $103B Day’s Range $61.25 – $65.67 52wk Range $61.25 – $109.50 Volume 2.2M Avg Vol 15M Gross Margin 65.04% Boston Scientific (BSX 9.06%), a maker of medical devices for interventional specialties, closed Monday at $62.92, down 9.03%. The stock moved lower on Monday
Vancouver, British Columbia–(Newsfile Corp. – March 30, 2026) – ICG Silver & Gold Ltd. (CSE: ICG) (“ICG” or the “Company”) is pleased to announce that, further to its news release dated February 26, 2026, it has closed a non-brokered unit offering for gross proceeds of $1.73 million (the “Unit Offering“). This brings the Company’s total gross proceeds raised
Over the last 7 days, the United States market has experienced a 1.9% decline, yet it remains up by 15% over the past year with annual earnings growth forecasted at 15%. In this dynamic environment, identifying dividend stocks that offer reliable income and potential for capital appreciation can be an effective strategy for investors seeking
Buying stocks that are down significantly from their highs can be unnerving. These are stocks that are likely facing some adversity or that were perhaps overvalued and have come down in price. But the risk and concern is that they’ll continue falling lower. If you’re investing for the long term, however, having patience with these
Planet Labs (NYSE: PL) stock tumbled 9.7% through 1:05 p.m. ET Monday, its third straight trading day of declines, after announcing Friday that it will redeem all of its outstanding public warrants. The move promises to increase the number of shares of Planet Labs outstanding if it prompts warrant holders to exercise their warrants rather
Micron (NASDAQ: MU) stock has been dropping more or less steadily the past two weeks — ever since earnings, in fact. The shares paused their slide Friday — but then resumed falling again on Monday, and as of 11:50 a.m. ET are down another 5.6%. The question is why — especially in light of the
FRAMINGHAM, Mass., March 30, 2026–(BUSINESS WIRE)–The TJX Companies, Inc. (NYSE: TJX) today announced that its Board of Directors has raised the amount of its quarterly dividend by 13% from the last dividend paid. The Board declared a regular quarterly dividend in the amount of $.48 per share, payable June 4, 2026, to shareholders of record
Buy low and sell high. Investors are certainly familiar with this popular adage regarding the stock market. It seems so simple. And of course, who doesn’t want to be able to successfully jump in and out of stocks? But this implies, at a high level, that you can properly time the market. While alluring, this
Janus Henderson Investors, an investment management company, released its “Global Sustainable Equity Fund” fourth-quarter 2025 investor letter. A copy of the letter can be downloaded here. In the fourth quarter of 2025, global equity markets experienced a significant upswing, with many indices hitting new all-time highs. Resilient equity markets, favorable monetary policies, and ongoing momentum
Over the last 7 days, the United States market has dropped 1.9%, while showing a notable 15% rise over the past year, with earnings expected to grow annually by the same percentage. In such a fluctuating market, identifying stocks with strong fundamentals and growth potential becomes crucial for investors seeking stability and opportunity. Penny stocks,
We recently compiled a list of the 10 Quality Value Stocks Likely to Make a Comeback According to Analysts. Alaska Air Group, Inc. is one of the best value stocks on this list. TheFly reported on March 23 that BMO Capital began coverage of ALK with an Outperform rating and a $50 price objective. The firm
There you have it, folks. The inaugural First Trade stock bracket semi-finals are set. Second-seeded Apple (60%) was voted as the stock you’d rather own over the next 10 years, beating Tesla (40%) with relative ease. That rounds out a Final Four that also includes Nvidia, Amazon, and Alphabet. Now for the first semi-final. Which
There’s no guaranteed way to become a millionaire, but investing in stocks can be one of the best. The stock market has delivered average annual returns of 10% for the past 50 years. (That includes up years and down years.) If you invested $10,000 in the S&P 500 index and could earn 10% average annual