The US economy may have just entered a recession.
According to data from the Bureau of Labor Statistics released Friday, the unemployment rate rose to 4.3% in July, up from 4.1% in June and from recent lows of 3.4% in April 2023.
The increase officially triggered the Sahm Rule — a recession indicator developed by former Fed economist Claudia Sahm — which says that the US economy is in a downturn when the three-month moving average of the unemployment rate rises by 0.5% from its 12-month low.
The gauge has a perfect track record through at least the last nine recessions.
St. Louis Fed
Despite the Sahm Rule’s impressive history, it is sometimes criticized because it fails to account for rising labor participation, which can raise the unemployment rate. Labor participation is indeed rising right now.
However, one job market indicator that isn’t influenced by participation rates — year-over-year growth in unemployed persons — also suggests that the US economy is in recessionary territory. The number of unemployed people has now grown by 14.5% year-over-year. Over at least the last 11 instances that this has happened, the economy has been in recession.
Piper Sandler
It’s important to keep in mind that just because these indicators have done a good job sounding the alarm about a downturn in the past doesn’t mean that this time will be the same.
Tom Essaye, the founder of Sevens Report Research, told Business Insider on Friday that other labor market indicators still point to a soft landing ahead — at least for the time being.
For example, weekly initial unemployment claims still sit at a fairly low 249,000, though they’re up from 194,000 in January. If they start to climb above 300,000 and reach toward 350,000, that would be the time to worry, he said. And while July’s jobs report was weaker than expected, with the US adding 114,000 jobs, the four-month moving average is still in a strong place, and further lackluster reports in the months ahead will be needed to establish a downward trend.
While things may be fine for the moment, however, history shows that when the labor market weakens to this degree, it usually deteriorates further — and sometimes quickly, as is evident in the charts above. Plus, employment data is backward-looking.
“With labor statistics being a lagging economy indicator, the real underlying economy can be even slower than the economic data suggests,” said Jack McIntyre, a portfolio manager at Brandywine Global, in a memo on Friday.
In addition to downcast labor market data, the ISM Manufacturing Index fell further into contraction territory this week, signaling that US manufacturing continues to slow. Job openings are also trending downward, sitting at 8.1 million in June compared to 12.1 million in March 2022.
Where do stocks go from here?
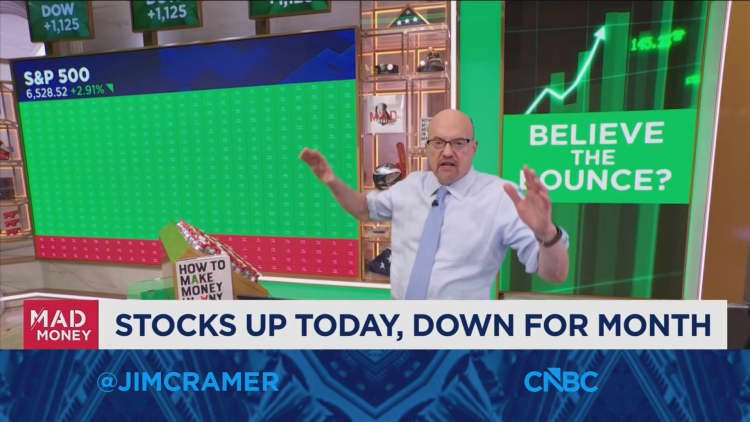
Investors are having a tough time digesting the downbeat economic data this week. The S&P 500 is down 5.6% from mid-July highs, while the Nasdaq 100 has fallen 10.8% from its July 10 top.
Where stocks go from here depends largely on how resilient the labor market proves in the months ahead as the Fed prepares its plan of action for its September meeting. Many strategists on Friday urged investors not to overreact to July’s jobs data.
“While worries of a policy mistake are rising, one negative miss shouldn’t lead to overreaction,” said Lara Castleton, US head of portfolio construction and strategy at Janus Henderson Investors, in a memo on Friday. “Equities selling off should be seen as a normal reaction, especially considering the high valuations in many pockets of the market.”
The market’s direction also depends on how investors interpret interest rate cuts alongside future data. While rate cuts are intended to stimulate the economy, helping businesses grow and consumers spend, investors can also interpret them as a sign that the Fed is worried about the economy’s health.
Michael Kantrowitz, the chief investment strategist at Piper Sandler, says falling rates will negatively affect stock market performance going forward.
Recent economic data “suggests that we’ve hit the mark where lower rates no longer a bullish catalyst for stocks,” Kantrowitz said in a note on Friday. “We expect that we will see a positive correlation between interest rates and stock prices going forward.”
Fed funds rate futures markets are now pricing in a 50-basis-point cut in September, according to the CME FedWatch Tool.
Michael Hartnett, the chief global strategist at Bank of America, said in a client note on Friday that investors should sell stocks on the first Fed rate cut, which is likely to come in September.
Hartnett and his team analyzed Fed rate-cutting cycles and identified three different types of rate cuts — cuts into a soft landing, cuts into a hard landing, and panic cuts, which are due to a credit event or some sort of Wall Street crisis. Hartnett believes the Fed is cutting into a hard landing (or recessionary) scenario, and the S&P 500 has fallen an average of 6.2% in the three months following the first rate cut in these instances. The largest decline was in 1974, when the index dropped 26% in three months.
“We say ‘sell the 1st cut’ as ‘hard landing’ risks (11% according to latest BofA Global [Fund Manager Survey]) clearly rising at a time of strong ‘soft’ (or ‘no’) landing consensus (86% according to FMS),” Hartnett wrote.