USD/JPY Analysis Today 01/10: Faces Volatility (Chart)

  • Amid the successive news about developments in the oil-rich Middle East region and the possibility of a large-scale war coinciding with the change in the policies of global central banks, the US dollar against the Japanese yen USD/JPY is moving in a range between 141.64 and 143.90 at the beginning of this exciting week’s trading.
  • Investor sentiment regarding risk appetite or lack thereof will affect the performance of the currency pair, in addition to the signals of central bank officials in the coming days.
  • At the beginning of this week’s trading, according to stock trading platforms, Chinese stocks rose by more than 6%, and the Japanese Nikkei index fell by 4.64% after economic reports.
  • Mainland Chinese stocks were up sharply, with the CSI 300 index jumping more than 6%, led by gains in the property sector, which rose 7.4%.

USD/JPY Analysis Today 01/10: Faces Volatility (graph)

In contrast, Japan’s Nikkei 225 fell 4.64% on Monday, with industrial production figures and market losses in the property sector playing a major role in the decline. As investors digested key economic data from both countries, the divergence in performance highlighted the divergent economic trajectories in East Asia.

China PMI Data

Economic data released on Monday from China showed some mixed signals. The official Purchasing Managers’ Index (PMI) for September came in at 49.8, slightly higher than the expected 49.5. While the reading was better than expected, it still represents the fifth consecutive month of contraction for the manufacturing sector, indicating continued weakness. Meanwhile, a private survey of purchasing managers conducted by S&P Global painted a gloomier picture. The manufacturing PMI fell to 49.3 in September, down from 50.4 in August, marking the fastest contraction in 14 months. This figure was below expectations at 50.5, highlighting the challenges faced by smaller companies in China’s private sector.

Overall, the CSI 300 index in mainland China rose by 6.22% despite the slowdown in manufacturing. Despite the struggles of the manufacturing sector, Chinese mainland stocks rose, with the CSI 300 index up 6.22%. Consumer and real estate stocks were the main drivers of this performance. The Hang Seng Mainland Properties Index rose by 8%, supported by hopes of economic stimulus and efforts to recover the beleaguered real estate sector.

The Hang Seng Index in Hong Kong also rose by 3.34%, supported by consumer stocks. Optimism surrounding China’s economic recovery overshadowed concerns about the manufacturing contraction, leading to strong gains in the stock markets. The Nikkei 225 index in Japan suffered sharp losses of 4.64%, with industrial production declining by 4.9%. At the same time, Japan had a tough start to the week, with the Nikkei 225 index falling by 4.64%. The real estate sector led the losses, while shares of Isetan Mitsukoshi Holdings, a department store holding company, was the biggest loser on the index, falling by 11%. The broader TOPIX index in Japan also fell by 3.3%.

According to the economic calendar, Japan’s industrial production fell 4.9% year-on-year in August, a significant drop from the previous month’s 0.4% decline. The drop was sharper than expected, with a 3.3% monthly decline, well above the expected 0.9% decline. The sharp contraction in industrial output added to the negative sentiment in Japanese markets.

While Japan’s retail sales rose by 2.8% in August, the Yen weakened. While the manufacturing and industrial sectors in Japan suffered, retail sales provided some positive news. Retail sales in August rose by 2.8% year-on-year, exceeding the 2.3% increase expected by economists. This followed a revised increase of 2.7% in July, indicating that consumer spending in Japan remains resilient despite broader economic challenges.

However, the Japanese yen weakened 0.13% against the US dollar, trading at 142.38. Overall, investors remain cautious as they weigh the implications of recent economic data and upcoming political changes in the country.

The political scene in Japan

In addition to the economic uncertainty in Japan, investors are also digesting the political shift following Shigeru Ishiba’s victory in the Liberal Democratic Party’s election. Ishiba will succeed Fumio Kishida as Japan’s prime minister, raising questions about potential political shifts that could impact Japan’s economy and markets in the coming months. Outside China and Japan, other Asian markets saw mixed results. Australia’s S&P/ASX 200 rose 0.72%, breaking an all-time high of 8,246.2. In South Korea, the Kospi fell 1.13%, while the smaller-cap Kosdaq fell 1.21%.

Dow Jones reaches a new high amid optimism about inflation data

In the United States, the Dow Jones Industrial Average reached a new high on Friday, rising 0.33% to close at 42313.00. This rise came as traders assessed new inflation data, as the Personal Consumption Expenditures (PCE) price index – the Federal Reserve’s preferred inflation measure – showed a year-on-year increase of 2.2% in August. This figure was in line with expectations and boosted hopes that inflation is gradually coming under control, giving US stocks a boost. However, the S&P 500 fell by 0.13%, while the Nasdaq Composite lost 0.39%.

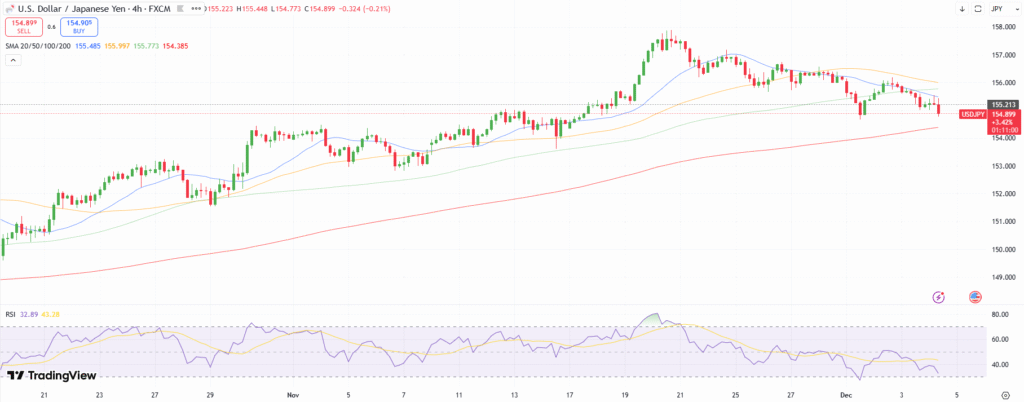
USD/JPY Technical Analysis and Expectations Today:

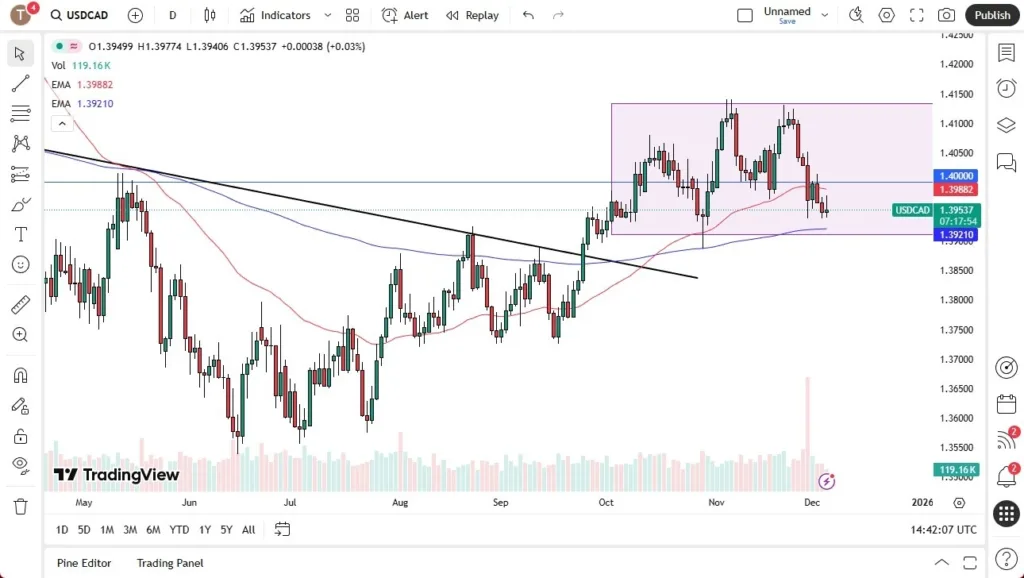
Based on the daily chart attached, the overall trend for USD/JPY remains bearish and as long as it is closer to the psychological support of 140.00, the bears will remain in control. At the same time, technical indicators are moving towards strong oversold levels. On the other hand, the first break of the overall trend will not happen without bulls moving towards the resistance levels of 147.95 and the psychological resistance of 150.00 respectively. Otherwise, the overall trend will remain bearish. Ultimately, the USD/JPY pair will remain on its current path until markets and investors react to the US jobs numbers and comments from Fed Chairman Jerome Powell.

Ready to trade our daily USD/JPY forex forecast? Here are the best forex brokers in Japan to choose from. 

Source link

Visited 1 times, 1 visit(s) today

Related Article

EUR/USD Weekly Forecast 07/12: Signs of Sentiment (Chart)

EUR/USD Weekly Forecast 07/12: Signs of Sentiment (Chart)

Created on December 07, 2025 The EUR/USD did gain this past week of trading. While speculators may not look upon at the upwards movement with as a significant outcome, the ability of the EUR/USD to finish around 1.16433 after starting the week near 1.16300 may prove important. However, there is a risk that the Fed

Weekly Forex Forecast - 07/12 to 12/12 2025 (Charts)

Weekly Forex Forecast – 07/12 to 12/12 2025 (Charts)

I wrote on the 30th November that the best trades for the week would be: Long of the USD/JPY currency pair following a daily close above ¥157.77. This did not set up. Long of the S&P 500 Index following a daily close above 6,920. This did not set up. Long of Silver with half the

Gold Weekly Technical Forecast

Gold Weekly Forecast: Rate Cut Bets, Weaker US Data Keep Bulls in Control

The Gold weekly forecast remains moderately supported by expectations of Fed easing. Uptick in US yields and improved risk appetite capped the gold gains. Markets await the FOMC rate decision and Fed Chair commentary, along with labor market data, next week. The gold price remained softer last week but managed to stay above the key

USD/CAD Price 07/12/2025

Weekly Pairs in Focus 7th to 12th December 2025 (Charts)

Created on December 07, 2025 The US dollar plunged against the Canadian dollar during the week but really accelerated to the downside as the Canadian employment numbers came out stronger than anticipated. Because of this, it looks as if the market is ready to roll over again, as we continue to see schizophrenic behavior. That

Image for RISK

Parents don forex trader hats to foot tuition bills abroad

New Delhi | Bengaluru: As the rupee enters the 90s against the dollar, parents of children studying abroad are bending over backwards—also becoming part-time currency traders—to combat rising cost pressures. From monitoring daily rate movements for topping up forex cards during periods of rupee appreciation to restructuring remittances, this admissions cycle has turned sophisticated financial

Four-hour DXY chart showing the U.S. Dollar Index pulling back toward the 98.60 support area. The image highlights the low that triggered the last 4h break of structure, along with the unmitigated September FVG below price, and a descending channel guiding recent bearish movement.

Weekly Forex Forecast For DXY, EURUSD, GBPUSD, And XAUUSD (December 8-12, 2025)

In today’s Weekly Forex Forecast, I’m breaking down my exact trade plan for the DXY, EURUSD, GBPUSD, and XAUUSD. Can the euro confirm last week’s bullish change of character on the 4-hour chart? I explain that and more in today’s video. US Dollar Index (DXY) Forecast The DXY did what I was anticipating last week

USD/CAD Weekly Technical Forecast

USD/CAD Weekly Forecast: Economic Divergence Triggers Sell-off, Eyes on FOMC

The USD/CAD weekly forecast remains bearish amid prevailing dollar weakness. The CAD gained as oil prices ticked up while Canada’s employment data remained upbeat. Markets await FOMC and BoC rate decisions due next week, while focus remains on the Fed Chair’s commentary. The USD/CAD slumped last week as the Canadian dollar gained renewed strength amid

USD/CAD Forecast 05/12: Sits at Support (Chart)

USD/CAD Forecast 05/12: Sits at Support (Chart)

Created on December 05, 2025 USD/CAD remains constrained as the 50-day EMA and the 1.40 level cap upside momentum, while the pair rests on the 200-day EMA. Traders await Canadian employment data and next week’s expected Federal Reserve rate cut for directional clarity. The US dollar initially rallied against the Canadian dollar during the trading

Gold Technical Price Analysis

Gold Price Resilient Amid Weaker Dollar, Eyes on US PCE Report

The gold price remains in positive territory as dollar weakness prevails. Geopolitics and potential Fed easing continue to underpin the demand for gold. Markets await the US PCE inflation report for fresh trading opportunities. The gold price held steady during the early European session on Friday, as the market tone remained cautious ahead of the

Gold Analysis 04/12: New Record Bullish Path (Chart)

New Record Bullish Path (Chart)

Created on December 04, 2025 Today’s Gold Analysis Overview: The overall of Gold Trend: Strongly Bullish. Today’s Gold Support Points: $4160 – $4100 – $4050 per ounce. Today’s Gold Resistance Points: $4250 – $4330 – $4400 per ounce. Today’s Gold Trading Signals: Sell Gold from the resistance level of $4290. Target $4060, Stop-Loss $4350. Buy

Market Realist Team - Author

What Surging Forex Volumes Reveal About Today’s Global Financial Markets

The extraordinary size of FX turnover highlights the central role currencies play in capital flows, trade, and global risk transfer. Source: Freepik Global foreign-exchange activity has accelerated sharply in recent years, revealing important shifts in how investors, institutions, and corporations respond to uncertainty in the broader financial landscape. One of the clearest indicators of this

EUR/USD Analysis 04/12: Trading Higher Ahead (Chart)

EUR/USD Analysis 04/12: Trading Higher Ahead (Chart)

Created on December 04, 2025 EUR/USD Analysis Summary Today Overall Trend: : Bullish bias. Support Levels for EUR/USD Today: 1.1620 – 1.1550 – 1.1480. Resistance Levels for EUR/USD Today: : 1.1720 – 1.1800 – 1.1880 EUR/USD Trading Signals: Buy EUR/USD from the support level of 1.1590 with a target of 1.1800 and a stop loss

GBP/USD Forex Signal 04/12: Looking Bullish (Chart)

GBP/USD Forex Signal 04/12: Looking Bullish (Chart)

Created on December 04, 2025 My previous GBP/USD signal on 2nd December was not triggered. Today’s GBP/USD Signals Risk 0.75%. Trades must be taken prior to 5pm Tokyo time Friday. Long Trade Ideas Long entry following a bullish price action reversal on the H1 timeframe immediately upon the next touch of $1.3326, $1.3289, or $1.3268.

USD/CAD Forex Signal 04/12: Approaching Support (Video)

USD/CAD Forex Signal 04/12: Approaching Support (Video)

Created on December 04, 2025 Potential signal: I am a buyer of USD/CAD with a stop loss at 1.39 and a target of 1.4130 USD/CAD trades between the 50-day and 200-day EMAs as momentum indicators signal potential short-term upside. With the FOMC meeting and key data ahead, volatility is expected, but a near-term bounce appears

Why December 2025 Is Important For FX Market?

Top 10 Forex Pairs to Watch This Month and Why They Matter

As markets enter December 2025, FX traders are navigating a shifting landscape: an increasingly dovish Federal Reserve (Fed), a possibly tightening Bank of Japan (BoJ), and stability or gradual normalization among other major central banks.  The final month of the year typically brings seasonal liquidity changes, thinner order books, and sharper price reactions to data

USD/JPY Technical Outlook

USD/JPY Outlook: Bears Break 155.00 Amid Hawkish BoJ, Weaker US Data

USD/JPY outlook remains weak as the dollar tumbles after weaker ADP data. The increasing odds of BoJ rate hikes provide moderate support to the yen. Rising JGB yields and FX intervention warnings weigh on the USD/JPY. The USD/JPY price is attempting to stabilize on Thursday after a sharp fall in the previous session. The pair

EUR/USD Technical Forecast

EUR/USD Forecast: Bullish Momentum Amid ECB-Fed Divergence, Weaker ADP

The EUR/USD forecast remains bullish as the dollar weakened further following the release of dismal ADP and Services PMI data. The ECB’s neutral monetary policy diverges from easing Fed support, with EUR/USD poised for upside. Markets await the US Jobless Claims and PCE inflation report data ahead. The EUR/USD forecast edges higher as the US

Foreign exchange trading in rubles is down by 96%

Foreign exchange trading in rubles is down by 96%

FACT: Foreign exchange trading in rubles is down by 96%. THE NUMBERS: Daily currency exchange* —              2019              2025 Change All currencies   $6.58 trillion   $9.60 trillion    +45% Dollar   $5.81 trillion   $8.56 trillion    +47% Euro   $2.13 trillion  

0
Would love your thoughts, please comment.x
()
x